

1 School of Biomedical Engineering, The University of British Columbia, Vancouver, BC, Canada
2 BC Children’s Hospital Research Institute, The University of British Columbia, Vancouver, BC, Canada
3 Pediatrics, The University of British Columbia, Vancouver, BC, Canada
4 Department of Radiology, Weill Cornell Medicine, New York, New York, USA
✉ Correspondence: Alexander Mark Weber <aweber@bcchr.ca>
Abstract
A 3T multimodal MR study of healthy adults (n=18; 10 female; 21.3 - 53.4 years) was performed to investigate the relationship between fMRI long-range temporal correlations and excitatory/inhibitory balance (via single voxel magnetic resonance spectroscopy measurements of glutamate and GABA). The study objective was to determine if the Hurst exponent (H) — an estimate of self-correlation and signal complexity — of the blood-oxygen-level-dependent signal was correlated with the excitatory-inhibitory (E:I) ratio. E:I has been proposed to serve as a control parameter for brain criticality — the theory that the brain operates near a critical point between order and disorder, optimizing information processing and adaptability — which H is believed to be a measure of. Thus, understanding if H and E:I are indeed correlated would clarify this relationship. Moreover, findings in this domain have implications for neurological and neuropsychiatric conditions with disrupted E:I balance, such as autism, schizophrenia, and Alzheimer’s disease. From a practical perspective, H is easier to accurately measure than E:I ratio at 3T MRI. If H can serve as a proxy for E:I, it may serve as a more practical clinical biomarker for this imbalance and for neuroscience research in general. The study collected functional MRI and magnetic resonance spectroscopy data during rest and movie-watching. H and E:I (glutamate/GABA) were not found to be correlated. H was found to increase with movie-watching compared to rest, while E:I did not change between conditions. This study represents the first attempt to investigate this connection in vivo in humans. We conclude that, at 3T and with our particular methodologies, no association was found. We end with lessons learned and suggestions for future research.
1 Introduction
The human brain consists of interconnected networks of neurons whose collective activity gives rise to complex behaviors and cognition. In order to understand how neural systems generate this emergent functionality, neuroscience is increasingly using tools and concepts from the science of complexity. Recent advances have led to the emergence of the Critical Brain Hypothesis, which posits that the brain — across all regions and networks — operates at a ‘critical point’, a state where both order and disorder are balanced to enable the most efficient information processing1–14. In fact, criticality is perhaps the main way that nature produces stable complex systems15,16. When in a critical state, the brain is optimally responsive to both internal and external stimuli while maintaining a balance between stability and instability1,2,13,14.
Currently, the most popular theory proposing how the brain achieves this delicate balance — what is known as the ‘control parameter’ — is the excitation-inhibition (E:I) ratio: the balance of excitatory and inhibitory neural activity, often operationalized as the ratio of the primary excitatory and inhibitory neurotransmitters (i.e. glutamate (Glu) and \(\gamma\)-aminobutyric acid (GABA))6,8–12. This theory essentially relies on the fact that E:I is a primary driver of the signal-to-noise ratio (SNR) of neuronal signalling, and hence could drive transitions between order and disorder6,17. Thus, the E:I theory of criticality posits that altering the E:I ratio would allow for movement between sub- and super-critical states6. When excitation is perfectly balanced with inhibition, the system is at a critical point, but if either excitation or inhibition are favoured, the system can become overly noisy (excess excitation) or overly controlled (excess inhibition), respectively6. Thus, the relationship between E:I balance and large-scale brain dynamics offers a promising link between synaptic physiology and macroscopic neural computation, and for elucidating fundamental neural computational principles. Furthermore, understanding this relationship could hold great clinical relevance, as disruptions in E:I homeostasis have been implicated in multiple neuropsychiatric and neurodevelopmental disorders — including autism, schizophrenia, and Alzheimer’s disease — making this an important target for biomarker development and therapeutic intervention10,18,19.
In vivo measurement of brain criticality can be achieved using several available methods, as systems near a critical state often exhibit fractal-like fluctuations or scale-invariance20. Scale-invariance has been observed extensively across various neuronal spatio-temporal scales, from dendritic branching structures21 in the spatial domain, to neurotransmitter release22, neuronal firing rates23, local field potentials24, electroencephalography (EEG)25 and functional magnetic resonance imaging (fMRI) — which measures the blood oxygen level-dependent (BOLD) signal26–28 — in the time domain. This fractal structure can be quantified by assessing the signal’s long-range temporal correlations (LRTC), which reflect the persistence or memory in a time series, where future values are statistically related to past values over long extended periods. The Hurst exponent (H) is a useful measure for evaluating LRTC28,29. An H value between 0.5 and 1 indicates a long-range positive correlation, with large values being followed by large values and small values by small ones. Conversely, an H exponent value between 0 and 0.5 indicates a long-range negative correlation, where large values are likely to be followed by small ones and vice versa. An H value of 0.5 is uncorrelated random noise30.
H has emerged as a valuable tool in neuroscience and clinical research. Typically, H values reported in adult brains are above 0.5, with higher H values in grey matter than white matter or cerebrospinal fluid31,32. Some key findings from neuroscience research include: a decrease in H during task performance33,34; an increase in H during movie watching in the visual resting state network35; negative correlations with task novelty and difficulty36; increases with age in the frontal and parietal lobes31, and hippocampus37; decreases with age in the insula, and limbic, occipital and temporal lobes31; and H < 0.5 in preterm infants38. For a more in depth review, see Campbell et al. (2022)28. In terms of clinical findings, abnormal H values have been identified in Alzheimer’s disease (AD)39,40, autism41–44, mild traumatic brain injury45, major depressive disorder46,47 and schizophrenia44,48. Crucially, these same disorders have been associated with imbalances in E:I10,18,19,49–52.
In addition to its implications for the critical brain hypothesis, establishing a connection between E:I and H could facilitate simpler estimation of excitatory and inhibitory neurotransmitters, as precise measurement of E:I is technically challenging53. Currently, magnetic resonance spectroscopy (MRS) is the only non-invasive method for in vivo assessment of the Glu/GABA ratio (excitatory to inhibitory neurotransmitters) in humans54,55. Unfortunately, MRS suffers from limited spatial and temporal resolution, with single-voxel spectrosopy sizes between 20 and 27 cm3, and scan times between 5-10 minutes12,53,54. In addition, quantification of GABA at 3T necessitates the use of a specialized J-difference spectral-editing sequence (such as MEGA-PRESS), in order to isolate GABA (at 3 ppm, 2.3 ppm, and 1.9 ppm) from overlapping peaks (e.g. creatine and glutamate)56. The need for this additional sequence therefore reduces the temporal resolution further. If H could function as a substitute for E:I, it could simplify the estimation of E:I.
Beyond clinical observations suggesting that both H and E:I imbalance are altered in neuropsychiatric conditions, several studies have attempted to show that critical-state dynamics emerge when excitation and inhibition are balanced. Indirect evidence comes from pharmacological manipulation of GABAergic neurotransmission, which has been shown to change the strength of LRTC in vitro57 and in the beta-frequency range in humans using EEG58; and to eliminate the power-law scaling of neuronal avalanches in rats59–61. More direct efforts linking H and E:I have mostly relied on computational models or animal studies6–12, and the results remain inconsistent, ranging from positive to negative or even U-shaped associations. These discrepancies may reflect differences in model systems (e.g., animal vs. computer simulations), methodological choices (such as how H or E:I are estimated), or may represent counter evidence against the theory that these measures are systematically related. Indeed, other theories for how the brain maintains criticality exist, such as neuromodulator regulation62–64 or synaptic plasticity65,66, to name a few. Despite the lack of direct evidence, several recent human studies have used fMRI-derived H as a direct proxy for E:I balance43,44,67,68; yet, no study to date has tested the empirical relationship between H and neurochemical estimates of E:I (e.g., Glu/GABA ratio) in vivo in humans.
The theory that E:I serves as the primary control parameter governing H — and, by extension, brain criticality — offers a framework with clear, falsifiable predictions that can be directly tested. Specifically, if this framework holds, E:I and H should covary systematically in the human brain across individuals, age, brain regions, and cognitive states. To empirically test this prediction, the present study examined the E:I–Hurst relationship in the human visual cortex during rest and naturalistic movie-watching. Although a single condition would be sufficient to test the correlation between E:I and H, we included two conditions to broaden the dynamic range of neural and neurochemical measures — thereby increasing our sensitivity to detect a correlation — and to provide validation that our metrics behave as expected across qualitatively different brain states. Naturalistic movie-watching is known to reliably engage the visual cortex with complex, temporally structured input, making it a useful condition for probing changes in the temporal dynamics of neural activity35,69. Prior work from our group has shown that H values increased during movie-watching compared to rest35, while work from others have found changes in Glu and GABA with sustained visual stimulation70–73. We hypothesized that H and Glu would increase during movie-watching35,70,71, that GABA would decrease72,73, and that H would be positively correlated with E:I in both conditions12.
2 Methods
2.1 Participants
Twenty-seven healthy adult participants were recruited to the study. One participant was not scanned due to claustrophobia while in the scanner. After our analysis and performing quality assurance (see below for details), a further eight participants were removed, leaving eighteen final participants, between the ages of 21.3 and 53.4 (mean age ± sd: 29.6 ± 8.7 years; 8 males). Sex, handedness and date of birth were recorded on the day of the scan.
2.2 Ethics Statement
Written informed consent was obtained from all participants. Ethics approval was granted by the Clinical Research Ethics Board at the University of British Columbia and BC Children’s & Women’s Hospital (H21-02686).
2.3 Scanning Procedure
After two anatomical sequences were acquired, participants were instructed to visually fixate on a cross-hair for 24 minutes (see Table 1 and below for more details). During this period, an fMRI, single-voxel semi Localization by Adiabatic SElective Refocusing (sLASER)74, and single-voxel MEscher-Garwood Point-REsolved SpectroScopy (MEGA-PRESS)75 sequences were acquired (see Figure 1 A and Section 2.4). Next, participants were instructed to watch a nature documentary (Our Planet (2019), Episode 3, “Jungles”76) for 24 minutes. During this period, another set of fMRI, sLASER, and MEGA-PRESS sequences were acquired. See Figure 1 B for a visual representation of the scanning protocol. Total scan duration was approximately 1 hour of uninterrupted scanning (i.e. subjects were not removed from the scanner). All participants followed the same order of conditions: rest then movie; all participants saw the same movie segment, beginning at the same time during the scan.
2.4 Acquisition Details
Scans were performed at BC Children’s Hospital MRI Research Facility on a 3.0 Tesla GE Discovery MR750 scanner (scanner software version: DV26.0_R03) with a Nova Medical 32 channel head coil. Participants changed into scrubs and were screened by an MRI technologist. Participants were given wax earplugs and a fiducial was placed on their left temple. Participants were provided with an audio headset and blanket once lying down on the scanner bed. Since visual stimuli were rear-projected, position and angle of mirror above patient eyes was adjusted for optimal movie viewing.
The following MRI scans were acquired. A 3D T1-weighted sagittal fast spoiled gradient echo (FSPGR) sequence; a 3D T2-weighted sagittal CUBE; a 2D echo-planar imaging (EPI) multi-echo gradient-echo fMRI sequence; a single-voxel MEGA-PRESS sequence with CHESS (CHEmical Shift Selective saturation) water suppression; and a single-voxel sLASER sequence with VAPOR (VAriable Power and Optimized Relaxations) water suppression. Details are listed in Table 1.
| Sequence | TE (ms) | TR (ms) | Flip Angle | FOV | Slice Thickness (mm) | In-Plane Resolution (mm²) | Other Parameters | Time (mins) |
|---|---|---|---|---|---|---|---|---|
| 3D T1-weighted FSPGR | 2.176 | 7.216 | 12 | 256 × 256 | 0.9 | 0.9375 × 0.9375 | - | 5 |
| 3D T2-weighted CUBE | 75.242 | 2,504.0 | 90 | 256 x 256 | 0.9 | 0.9375 × 0.9375 | - | 4 |
| 2D EPI Multi-Echo fMRI | 12.2, 35.352, 58.504 | 1,500 | 52 | 64 x 64 | 3.6 | 3.5938 × 3.5938 | Acceleration factor = 6 | 12 |
| sLASER | 35 | 2,000 | 90 | - | 28.0 | 28.0 x 28.0 | Transients = 128*; Spectral width = 5,000 Hz; Data points = 4,096 | 4 |
| MEGA-PRESS | 68 | 1,800 | 90 | - | 28.0 | 28.0 x 28.0 | Transients = 128 ON, 128 OFF; Spectral width = 5,000 Hz; Data points = 4,096 | 8 |
For both MRS sequences, the voxel size was set to 2.8 x 2.8 x 2.8 cm3. MRS voxels were rotated and placed in the occipital lobe, aligned along the calcarine fissure, using the high resolution T1w sequence as anatomical guide. Voxel placement was set once at the beginning and copied for the remaining MRS sequences. Glutamate was quantified from semi-LASER acquisitions as it offers the highest quality spectra for unedited metabolites78. The GE semi-LASER sequence automatically aligned and averaged every 32 transients, resulting in 4 averaged transients to process. GABA was measured using MEGA-PRESS, which applies frequency-selective editing pulses to isolate GABA from overlapping signals56. This dual-sequence approach is standard in the field and reflects the differing spectral requirements of each metabolite79. Finally, blip-up and blip-down spin-echo versions of the fMRI sequence were acquired at the end to estimate the B0 non-uniformity map for fMRI phase distortion correction.
2.5 Image Processing
Our full image processing pipeline has been can be accessed from our Github account page: github.com/WeberLab/EI_Hurst_Analysis
Images were downloaded offline from the scanner in raw Digital Imaging and Communications in Medicine (DICOM) format. DICOM files were then converted to Neuroimaging Informatics Technology Initiative (NIfTI) using Chris Rorden’s dcm2niix80 (v1.0.20211006) and then to Brain Imaging Data Structure (BIDS)81 format using dcm2bids82 (v2.1.6). MRS files were downloaded as raw P files.
2.5.1 Structural Images
The T1w image was corrected for intensity non-uniformity with N4BiasFieldCorrection83 (ANTs84; v2.3.335) to be used as a T1w-reference for the rest of the workflow. The T1w-reference was skull-stripped using a Nipype85 implementation of antsBrainExtraction.sh from ANTs; OASIS30ANTs was used as a target template. Fast86 (FSL87 v.6.0.5.1:57b01774, RRID: SCR_002823) was used for brain tissue segmentation into cerebrospinal fluid (CSF), white matter (WM), and gray matter (GM). Brain surfaces were reconstructed with recon-all88 (FreeSurfer88 7.3.2, RRID: SCR_001847). The previously-estimated brain mask was refined with Mindboggle89 (RRID:SCR_002438) to reconcile ANTs-derived and FreeSurfer-derived segmentations of cortical GM. AntsRegistration84 (ANTs 2.3.3) was used to perform volume-based spatial normalization to two standard spaces: MNI152NLin2009cAsym and MNI152NLin6Asym. Normalization used brain-extracted versions of both T1w reference and T1w template.
2.5.2 fMRI
Using fMRIPrep90, the shortest echo of the BOLD run was used to generate a reference volume (both skull-stripped and skull-included). Head-motion parameters with respect to the BOLD reference (transformation matrices as well as six corresponding rotation and translation parameters) were estimated before spatiotemporal filtering using mcflirt91 (FSL v6.0.5.1:57b01774). The fieldmap was aligned with rigid registration to the target EPI reference run. Field coefficients were mapped to the reference EPI using the transform. BOLD runs were slice-time corrected to 643 ms (half of slice acquisition range of 0-1290 ms) using 3dTshift from AFNI92 (RRIS: SCR_005927). To estimate T2* map from preprocessed EPI echoes, a voxel-wise fitting was performed by fitting the maximum number of echoes with reliable echoes in a particular voxel to a monoexponential signal decay model with nonlinear regression. Initial values were T2/S0 estimates from a log-linear regression fit. This calculated T2 map was then used to optimally combine preprocessed BOLD across echoes using the method by Posse et al. (1999)93. The generated BOLD reference was then co-registered (6 degrees of freedom) to the T1w reference with bbregister (FreeSurfer88) using boundary-based registration. First, a reference volume and its skull-stripped equivalent were generated with fMRIPrep. Confounding time series were calculated from preprocessed BOLD: framewise displacement (FD), DVARS, and three region-wise global signals. Tedana94 was then used to denoise the data by decomposing the multi-echo BOLD data via principal component analysis (PCA) and independent component analysis (ICA). The resulting components are automatically analyzed to determine whether they are TE-dependent or -independent. TE-dependent components were classified as BOLD, while TE-independent components were classified as non-BOLD and were discarded as part of data cleaning.
Participants were excluded from further analysis if their mean FD was > 0.15 mm.
2.6 MRS
sLASER data were processed using Osprey95 (v2.9.5) and fit via the embedded LCModel (v6.3-1N) wrapper96. Because of substantial overlap among Glu and Gln resonances97,98, in order to avoid errors in spectral assignment — especially since it is controversial whether Glu can reliably be separated from Gln at 3T99,100 — we report Glx (Glu+ Glu) as the primary outcome measure. Individual Glu estimates are provided in Supplementary Materials Table S5, alongside all other quantified metabolites. Several Osprey functions were modified to accommodate scanner-specific features of the GE implementation, where individual transients had been averaged by the scanner into four sub-spectra prior to export. These changes primarily affected GEload.m to correct water-scaling inconsistencies. RF coil combination was performed using generalized least squares (GLS) weighting, following An et al. (2013)101,102.
MEGA-PRESS data were processed with Osprey, and the difference of the ON and OFF sequences were fit the LCModel algorithm. Due to the J-editing sequence of MEGA-PRESS, a challenge of GABA quantification is macromolecule quantification103. As a result, we report GABA+, a measure which co-reports GABA with macromolecules. Macromolecules (MM) are expected to account for approximately 45% of the GABA+ signal103. While a macromolecule-suppressed estimate of GABA seems ideal, a recent 25-site and multi-vendor study conducted at 3T found that GABA+ showed much lower coefficient of variation than MM-suppressed GABA, meaning that GABA+ is more consistent across research sites and MRI vendors (i.e., Philips, GE, Siemens)104. Moreover, GABA+ shows greater reliability for both creatine-referenced and water-suppressed estimates104,105. MM-suppressed GABA and GABA+ estimates are also correlated, albeit weakly- to moderately-so103–105. Consequently, we report GABA+ to allow for easier comparison of our results to other studies as well as reproducibility. All metabolite values, including GABA, are reported in the Supplementary Materials Table S6.
MRS voxels were co-registered to the T1w reference image and segmented by SPM12106 into CSF, GM, and WM. sLASER and MEGA-PRESS data were were water-scaled as well as tissue- and relaxation-corrected by the Gasparovic et al. (2006) method107. Concentrations are reported in millimoles. Full width half-maximum (FWHM) of the single-Lorentzian fit of the water peak, signal-to-noise (SNR) ratio of the creatine signal, frequency shift, and Cramer-Rao lower bounds (CRLB) were calculated for quality assurance purposes. Osprey basis sets were used for linear combination. Metabolites included for both basis sets were: Asc, Asp, Cr, CrCH2, EA, GABA, GPC, GSH, Gln, Glu, Gly, H2O, Lac, NAA, NAAG, PCh, PCr, PE, Ser, Tau, mI, and sI. Excitatory-inhibitory ratio (E:I) was calculated as [Glx from sLASER]/[GABA+ from MEGA-PRESS], a common practice to report E:I using MRS108.
Participants were excluded from further analysis if any of their MRS scans had a water peak FWHM > 10109.
To quantify the inter-subject consistency across the MRS masks, we computed a consensus mask using majority voting and calculated the mean Dice coefficient between each individual mask and the consensus.
2.6.1 Re-analysis using Gannet
Glutamate and GABA were acquired using different MRS sequences and in separate blocks during the same scan session. While acquisitions were closely timed and performed under similar conditions, we cannot fully exclude the possibility of session-related variability affecting E:I ratio estimates. Therefore, we re-ran our analysis using the Glx and GABA+ values from the MEGA-PRESS sequence alone using Gannet110 (v3.3.0).
2.7 Hurst Exponent Calculation
Hurst exponent was calculated from the power spectrum density (PSD) of the BOLD signal. A log-log plot was used, where log power was plotted against log frequency; generally, if a log-log plot results in a linear relationship, it is assumed that the mean slope of this line represents the power-law exponent5. A PSD shows the distribution of signal variance (‘power’) across frequencies. Complex signals are classified into two categories: fractional Gaussian noise (fGn) and fractional Brownian motion (fBm)29,111. The former is a stationary signal (i.e., does not vary over time), while the latter is non-stationary with stationary increments29. Most physiological signals consist of fBm, but fMRI BOLD is typically conceptualized as fGn once motion-corrected; otherwise put, unprocessed BOLD signal is initially fBm which is converted to fGn with appropriate processing112. fBm and fGn require distinct H calculation methods29. PSD was estimated using Welch’s method113 from the Python Scipy.Signal library114. Data were divided into 8 windows of 50% overlap and averaged within each window, as is standard115. Welch’s method was selected based on prior comparisons with other Hurst exponent algorithms, which found it to perform best across all evaluation criteria115. The spectral index, \(\beta\), was calculated from the full frequency spectrum. The spectral index was then converted to H using the following equation29,116:
\[ H = \frac{1 + \beta}{2} \]
Since it cannot be assumed that all fBm is removed from the signal, we employed the ‘extended Hurst’ (H’) concept in this study: for 0 < H < 1, the signal is understood as fGn, while for 1 < H < 2, the signal is understood to be fBm35,117,118. More generally, it is assumed that when 0.5 < H < 1.5, the signal displays 1/f behaviour5. H was calculated for all voxels in the brain of each subject. A brain mask was then applied which included only GM and the region of the MRS voxel in the visual cortex. H was averaged across the brain mask area, using only non-zero voxels.
2.8 Statistics
All statistical analyses were performed using R119 (v4.5.1) and RStudio.
A linear mixed-effect model was used to test for the correlation of H and E:I, with H as the dependent variable, Glx/GABA+ as the primary predictor of interest, and Condition (rest vs. movie) as a fixed effect. Mean FD, FWHM(sLASER), FWHM(MEGA-PRESS), Frequency Shift (sLASER), Frequency Shift (MEGA-PRESS) were included as covariates, and subjects were modeled as random effects:
\[ \begin{aligned} \mathrm{H} \sim\;& \frac{\mathrm{Glx}}{\mathrm{GABA\text{+}}} + \mathrm{Condition} +\mathrm{meanFD} \\ & + \mathrm{FWHM_{sLASER}} + \mathrm{FWHM_{MEGA\text{-}PRESS}} \\ & + \mathrm{FreqShift_{sLASER}} + \mathrm{FreqShift_{MEGA\text{-}PRESS}} \\ & + (1 | \mathrm{Subject}) \end{aligned} \]
A post-hoc calculation of the power of the model was calculated using powerSim from the simr package using 1,000 simulations.
Exploratory post hoc analyses were then performed. Difference in the means of H, Glx, and GABA+ between rest and movie conditions were assessed using paired Student’s t-tests120. Correlations between H and Glx, GABA+ and E:I were calculated using Pearson’s method121.
3 Results
3.1 Participant Demographics
Twenty-seven participants were originally recruited for the study. Twenty-six of these participants were successfully scanned, but one participant experienced claustrophobia and chose not to continue. Of the remaining 26 participants, 18 were included in the final analysis: three were removed due to low MRS quality (FWHM > 10) and five were removed due to low fMRI quality (mean FD > 0.15 mm). See Figure 2.
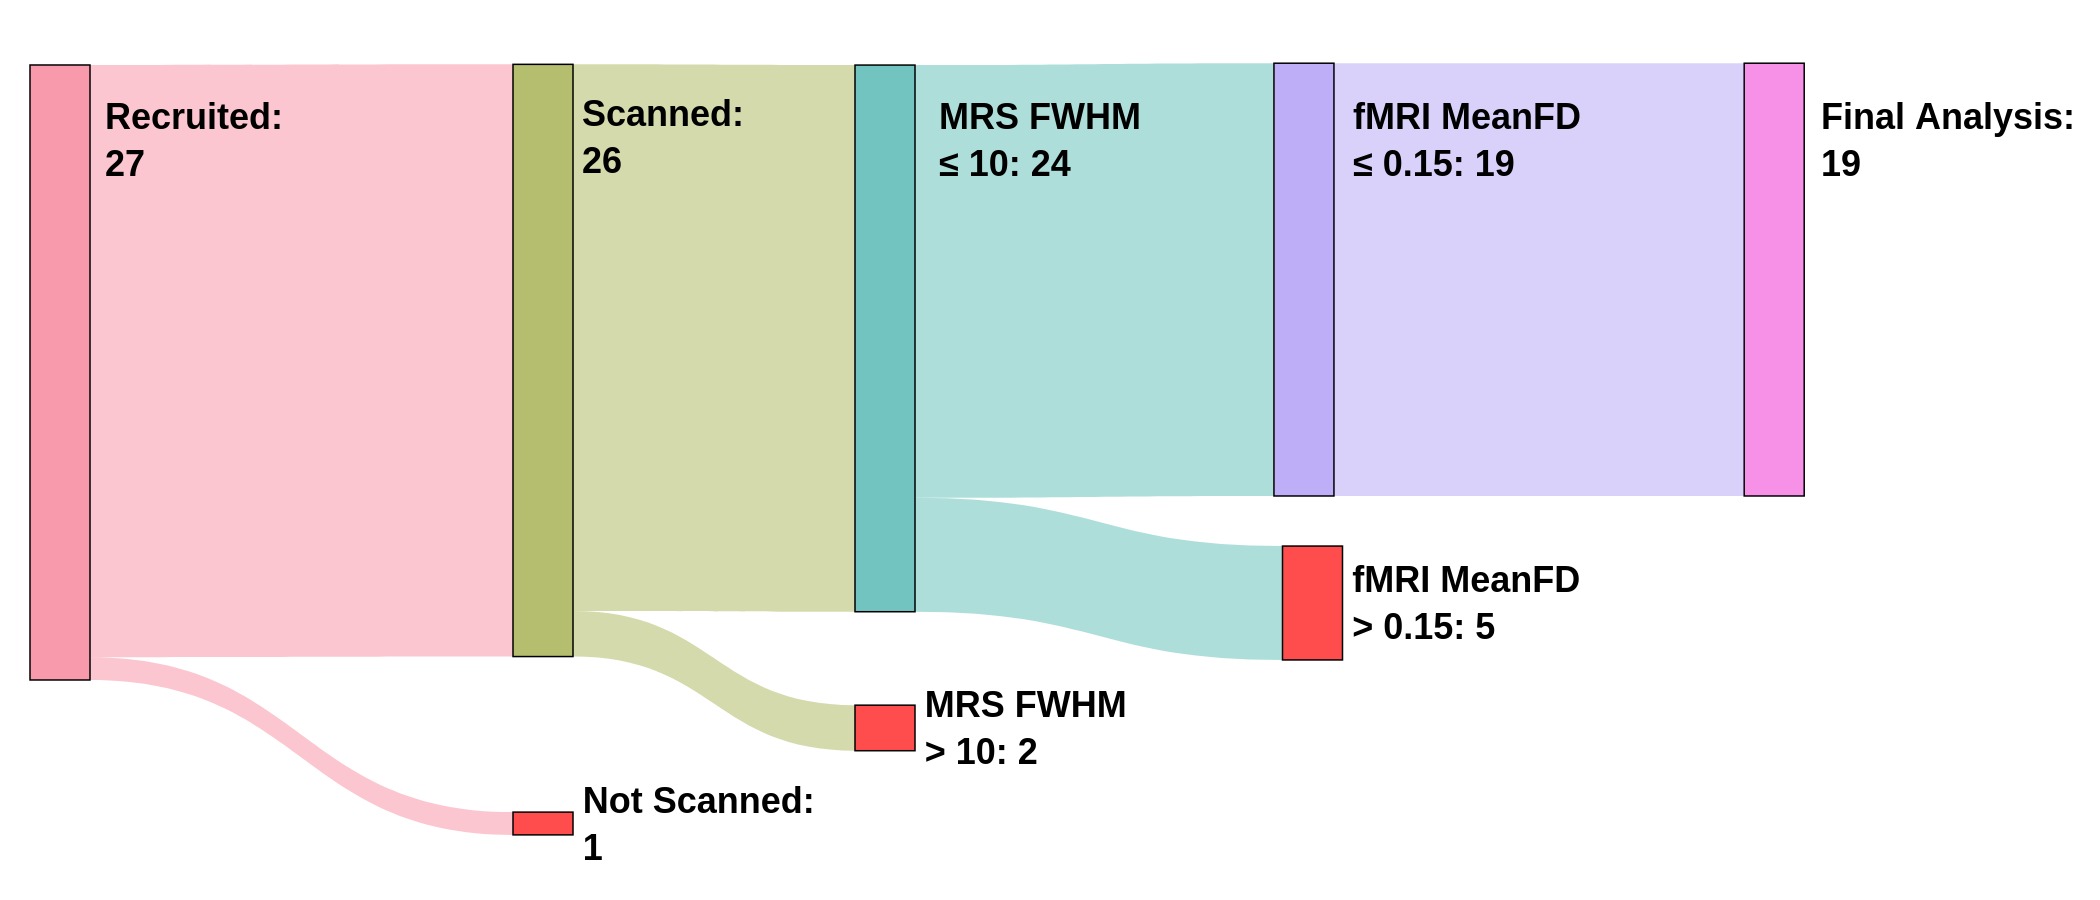
The final study sample included 8 males and 10 females between ages 21.3 and 53.4, with a mean age and standard deviation of 29.6 ± 8.7 years.
3.2 Data Summary
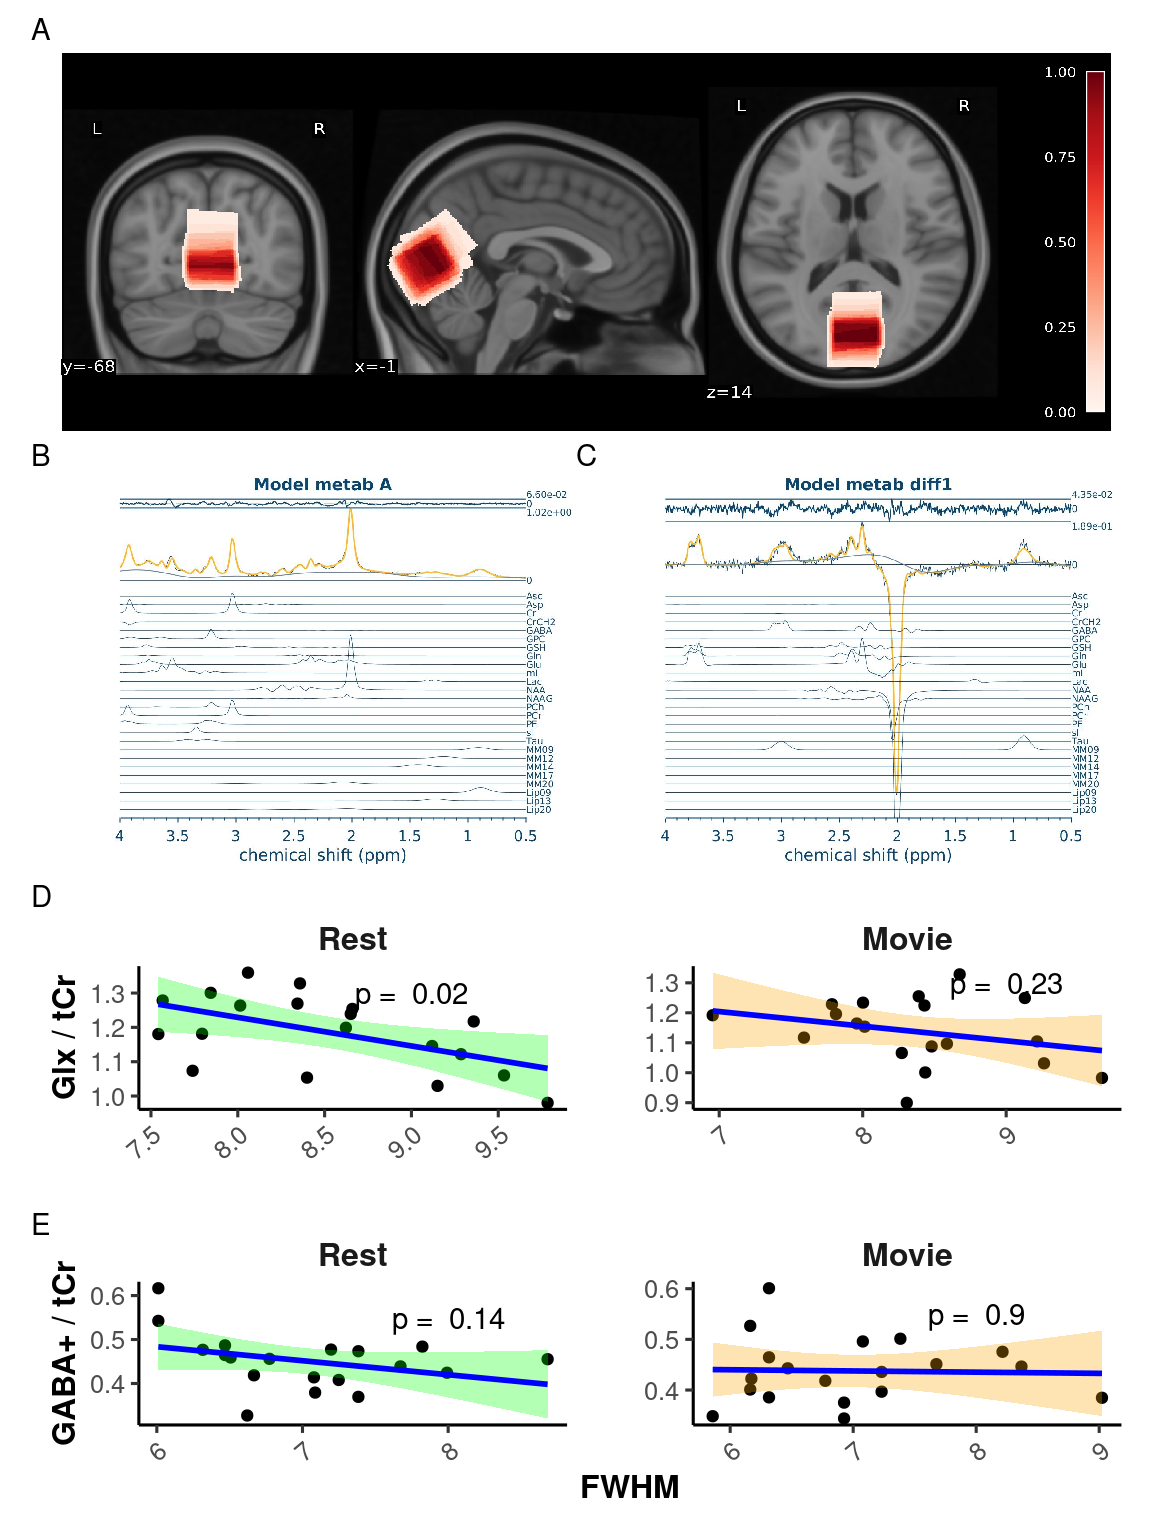
An average of all MRS voxel placements can be seen in Figure 3 A, and a sample of the Osprey sLASER and MEGA-PRESS spectrum fits at rest can be seen in Figure 3 B and C, respectively. The mean consensus-based inter-subject Dice score for MRS voxel placements was 0.77 \(\pm\) 0.14 (range: [0.35, 0.95]).
Average water FWHM, creatine SNR, and frequency shift are reported in Supplementary Material Table S1.
Average voxel rotation along the x-axis, along with average tissue fractions are reported in Supplementary Material Table S2.
A sample of the combined grey-matter and MRS voxel mask used to average H values, along with a sample Hurst exponent map, and sample fits for H calculation during rest can be found in Figure 4 A, B, and C, respectively.
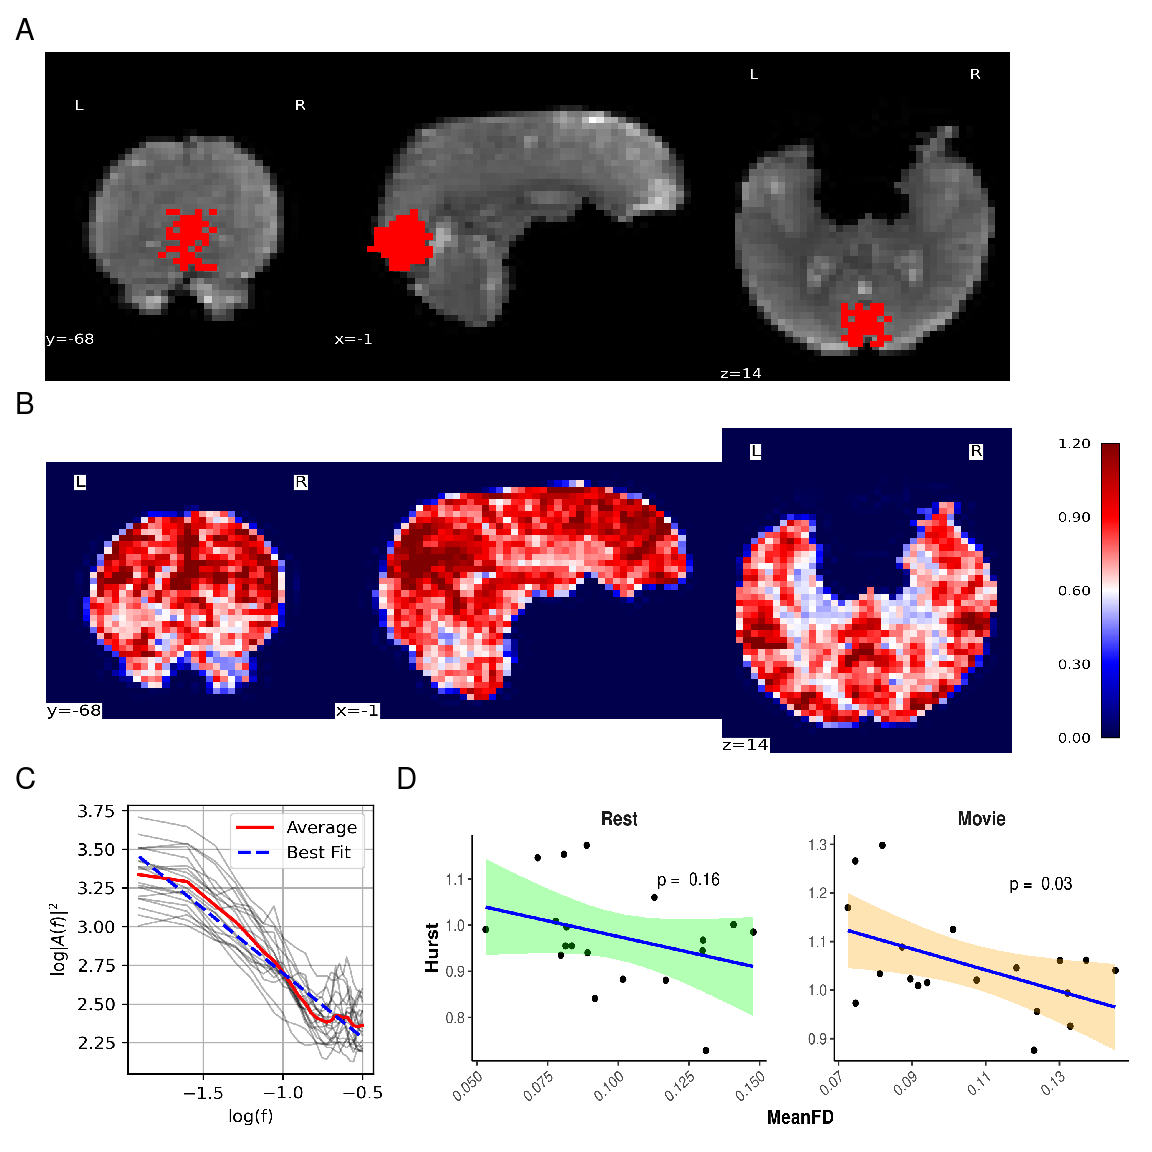
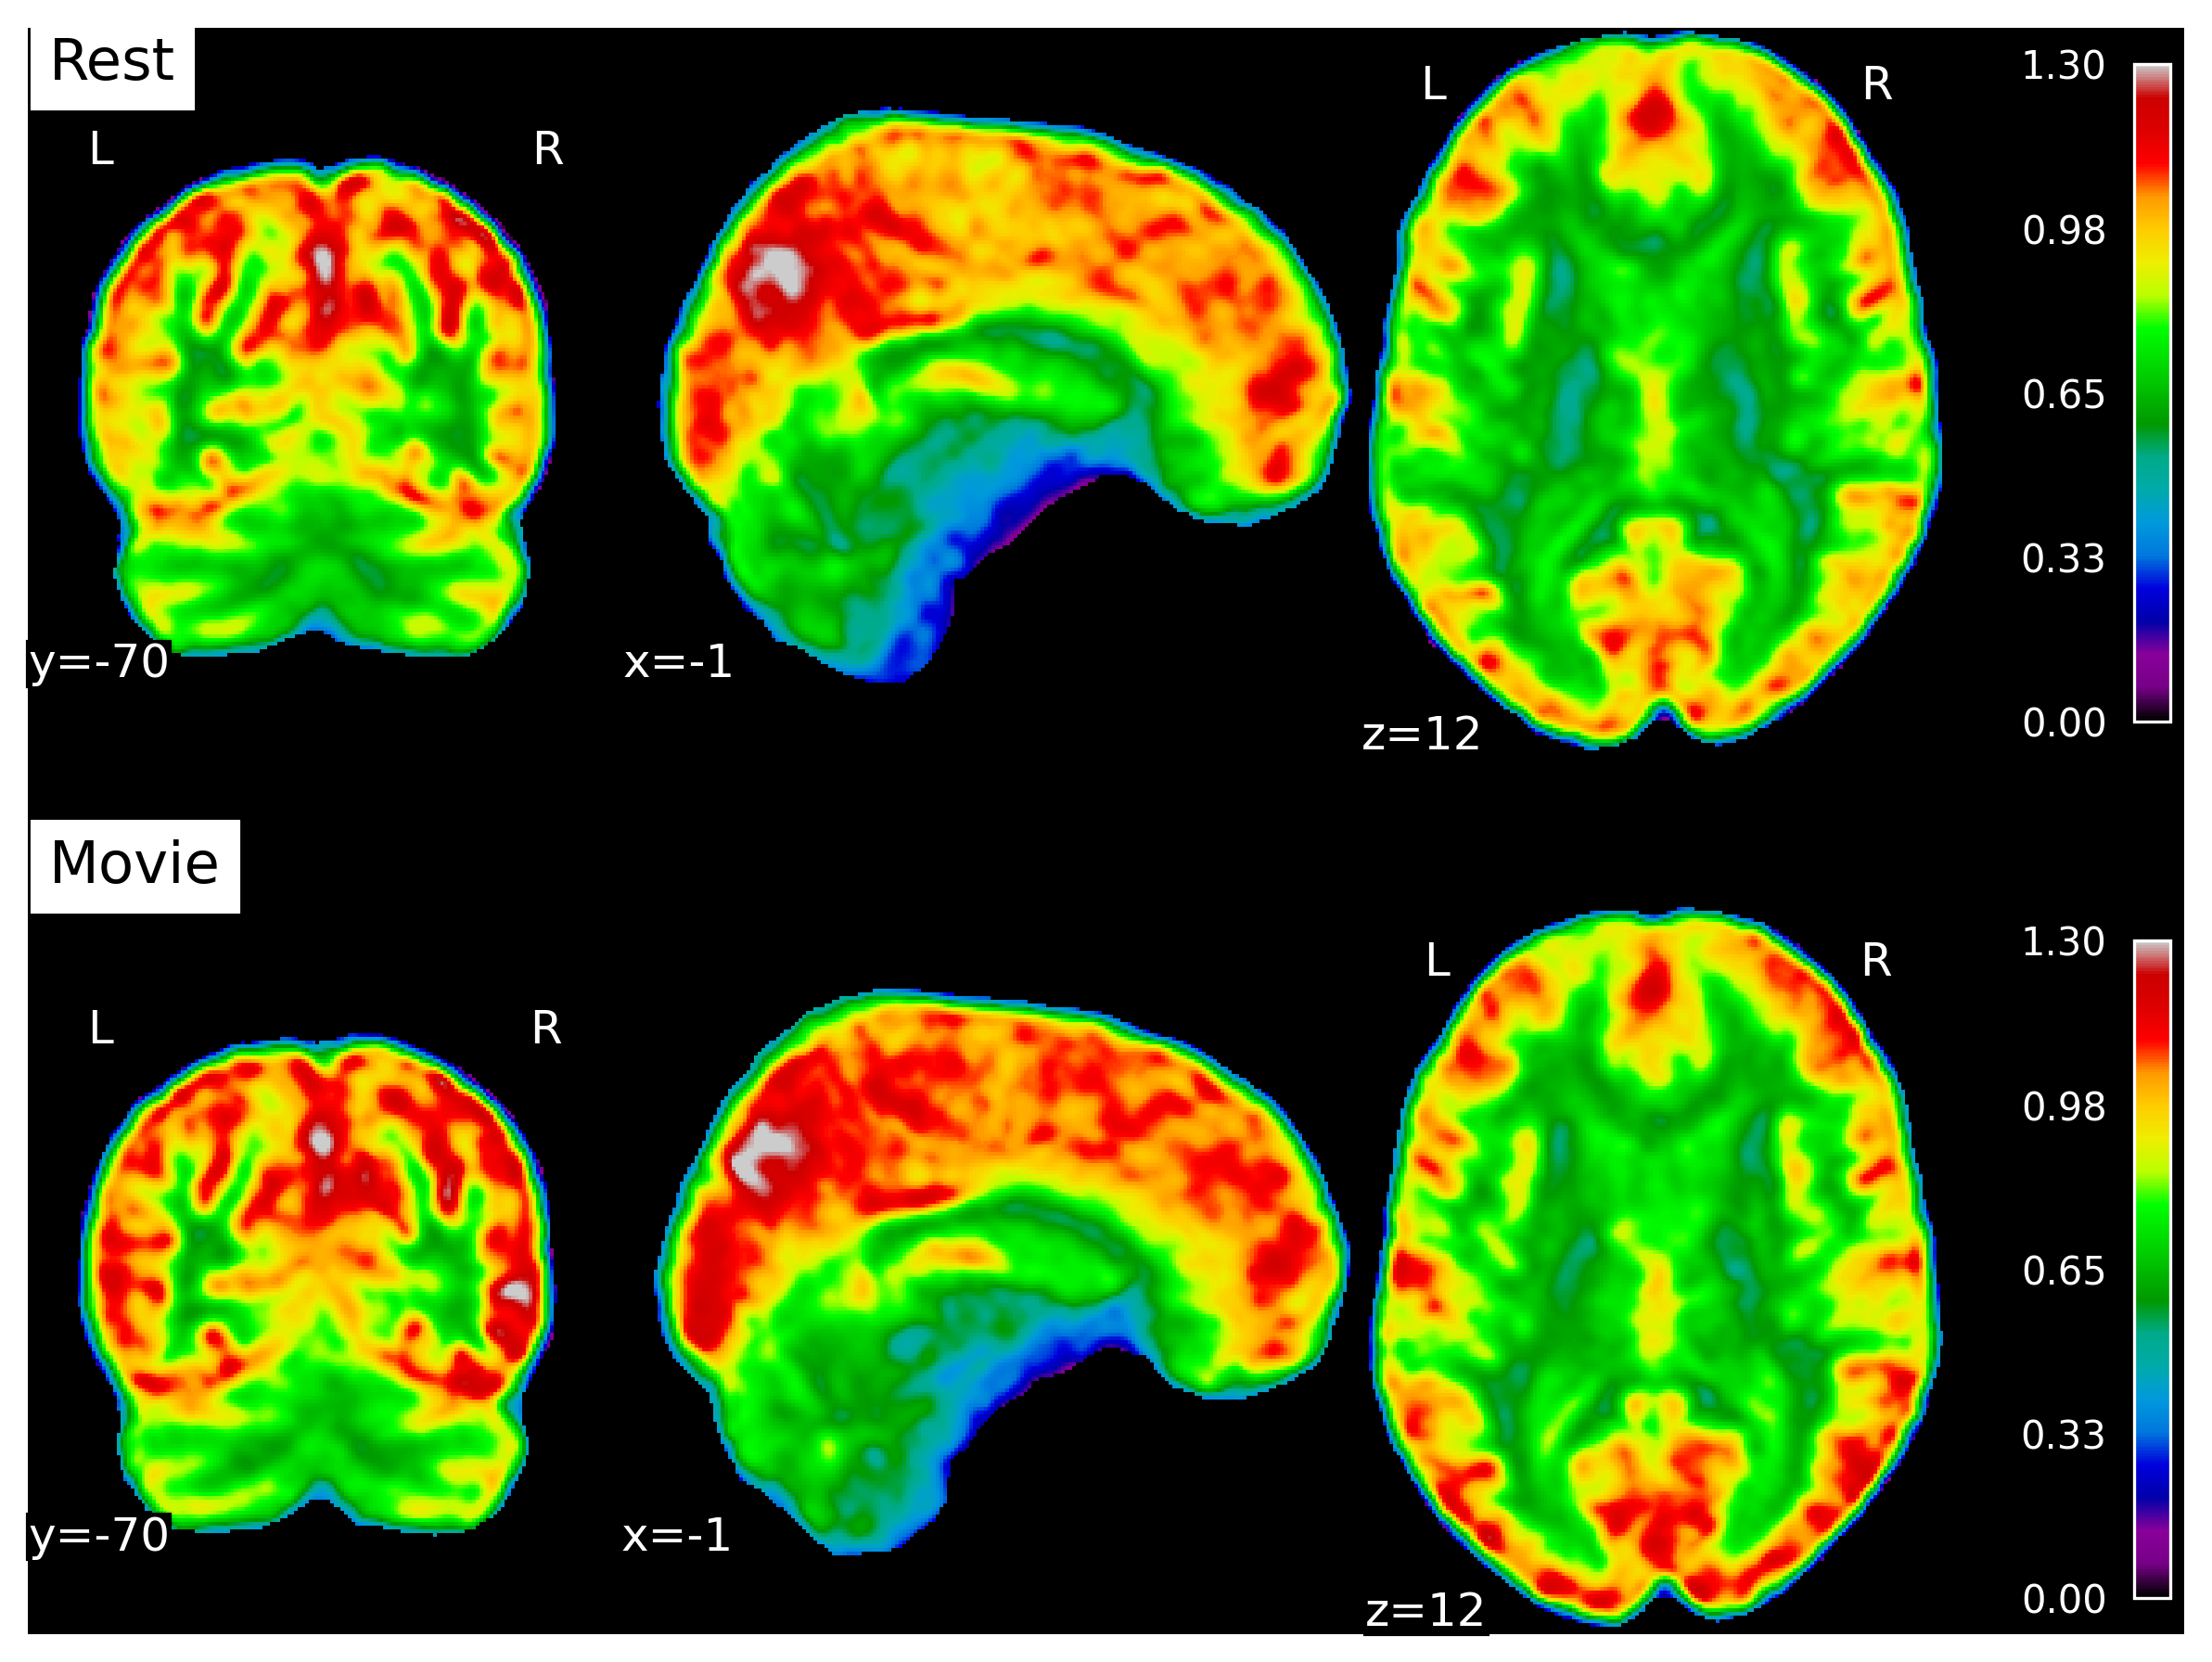
Figure 5 shows the average Hurst maps during rest and movie watching.
3.3 Linear-mixed effects model: H and E:I
To examine the relationship between H and E:I, we ran a linear mixed-effects model. The model’s total explanatory power was substantial (conditional r2 = 0.79), with fixed effects (marginal r2) equal to 0.22. The model’s intercept, corresponding to EI = 0, Condition = Movie, FWHMsLASER = 0, FWHMMEGA-PRESS = 0, FreqShiftsLASER = 0, FreqShiftMEGA-PRESS = 0, and meanFD = 0, was 1.3 (95% CI [0.66, 1.95], t(26) = 3.95, p < 0.01).
Among the fixed effects, only the effect of Condition [Rest] (beta = -0.07, 95% CI [-0.11, -0.02], t(26) = -2.84, p = 0.02); and Frequency Shift (sLASER) (beta = 0.03, 95% CI [0.01, 0.06], t(26) = 2.31, p = 0.05) were statistically significant. All other predictors — including E:I (beta = 0.07, 95% CI [-0.05, 0.19], t(26) = 1.12, p = 0.28); along with FWHMMEGA-PRESS (beta = 0.01, 95% CI [-0.05, 0.07], t(26) = 0.28, p = 0.78); FWHMsLASER (beta = -0.02, 95% CI [-0.09, 0.05], t(26) = -0.58, p = 0.57); FreqShiftMEGA-PRESS (beta = 0.03, 95% CI [-0.01, 0.06], t(26) = 1.56, p = 0.14); FreqShiftsLASER (beta = 0.03, 95% CI [0.01, 0.06], t(26) = 2.31, p = 0.05); and meanFD (beta = -0.59, 95% CI [-2.14, 0.96], t(26) = -0.75, p = 0.46) — were not statistically significant.
3.4 Post-hoc analyses
Diagnostics of our linear-mixed effects model can be found in the Supplementary Materials (Figure S1; Table S3; and Table S4)
To calculate the post-hoc power of our model, we required an effect size. While in silico and animal studies indicate that changes in E:I ratio influence the Hurst exponent11, these models do not provide standardized effect sizes, and translation to human neuroimaging remains uncertain. Therefore, we used several effect sizes, and report here the power of each. The effect sizes we used to calculate power were: the value calculated from our model (beta = 0.07); and beta values two and three times that size: 0.14 and 0.21. As a reminder, beta represents the increase of H by that amount per every increase of E:I by 1. The power for these effect sizes were 25.7%, 64.2%, and 93%, respectively.
Furthermore, as our spectroscopy quality metrics could be highly correlated with each other (e.g., FWHM measures from the two sequences, or frequency shifts), we checked variance inflation factors (VIFs) to ensure all values were < 5 (generally acceptable). VIFs were: EI = 1.24, Condition = 1.55, FWHMsLASER = 1.76, FWHMMEGA = 1.45, FreqShiftsLASER = 1.15, FreqShiftMEGA = 1.48, and MeanFD = 1.28.
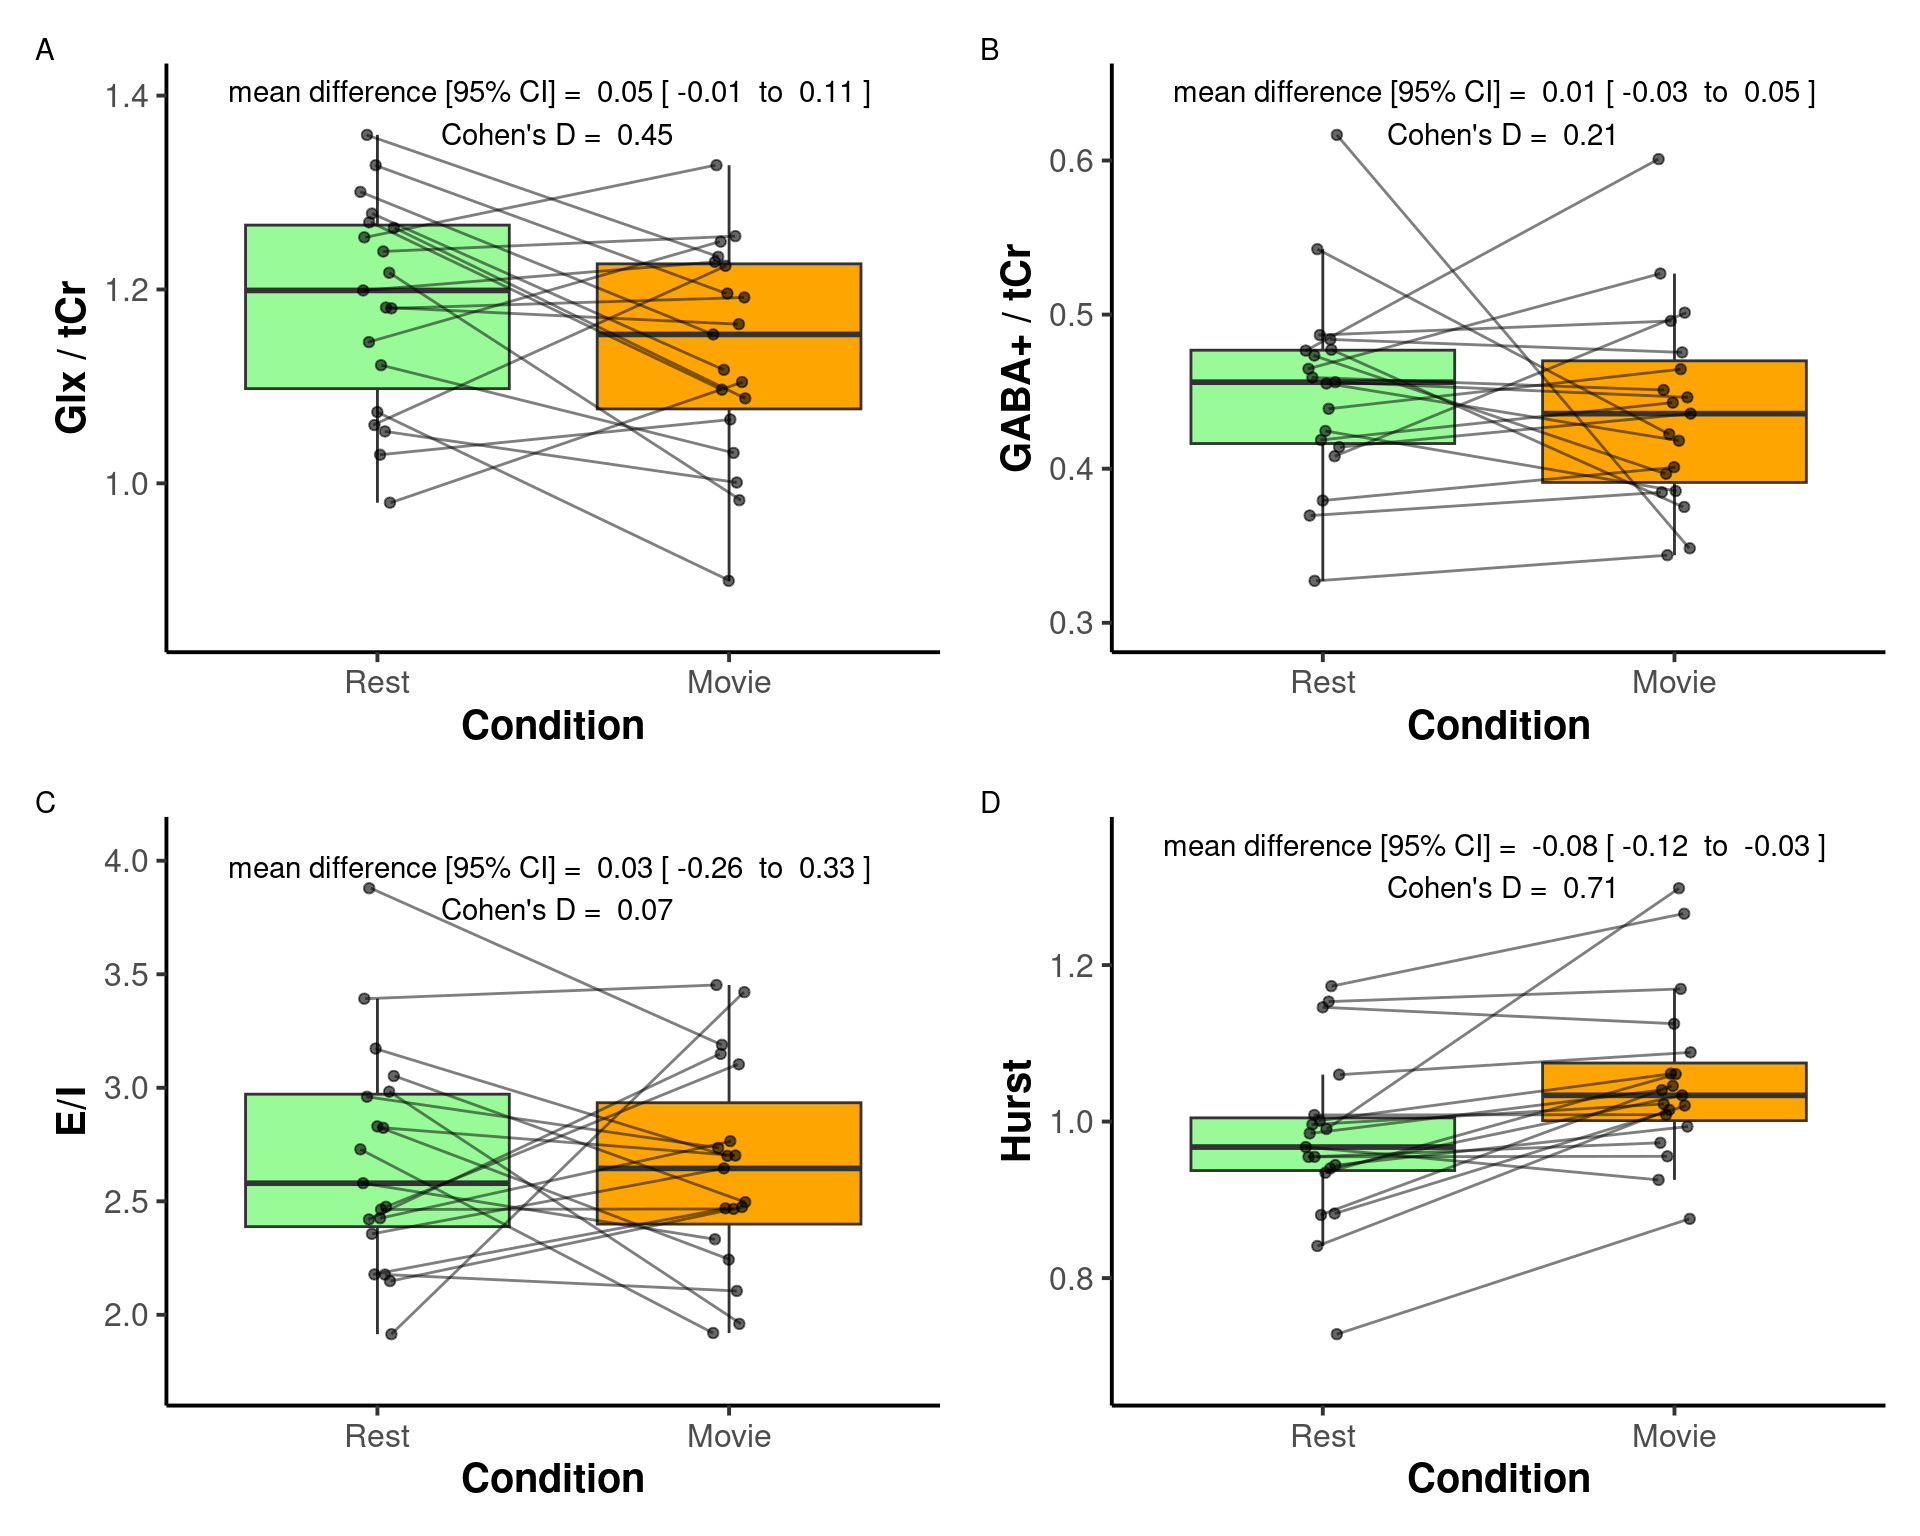
Mean ± sd of the main metabolites, their Cramer-Rao lower bounds, E:I, and H during rest and movie are reported in Table 2. Boxplots between rest and movie can be seen in Figure 6. Neither Glx nor GABA+ were different between movie and rest conditions. E:I ratio did not change between conditions either. H was found to be greater during movie watching than rest.
| Rest | Movie | p-value | |
|---|---|---|---|
| Glx | 9.84 ± 1.06 | 10.04 ± 0.79 | 0.26 |
| GABA+ | 5.48 ± 0.77 | 5.23 ± 0.71 | 0.17 |
| E:I Ratio | 1.82 ± 0.25 | 1.94 ± 0.25 | 0.08 |
| H | 0.98 ± 0.98 | 1.05 ± 1.05 | < 0.01 |
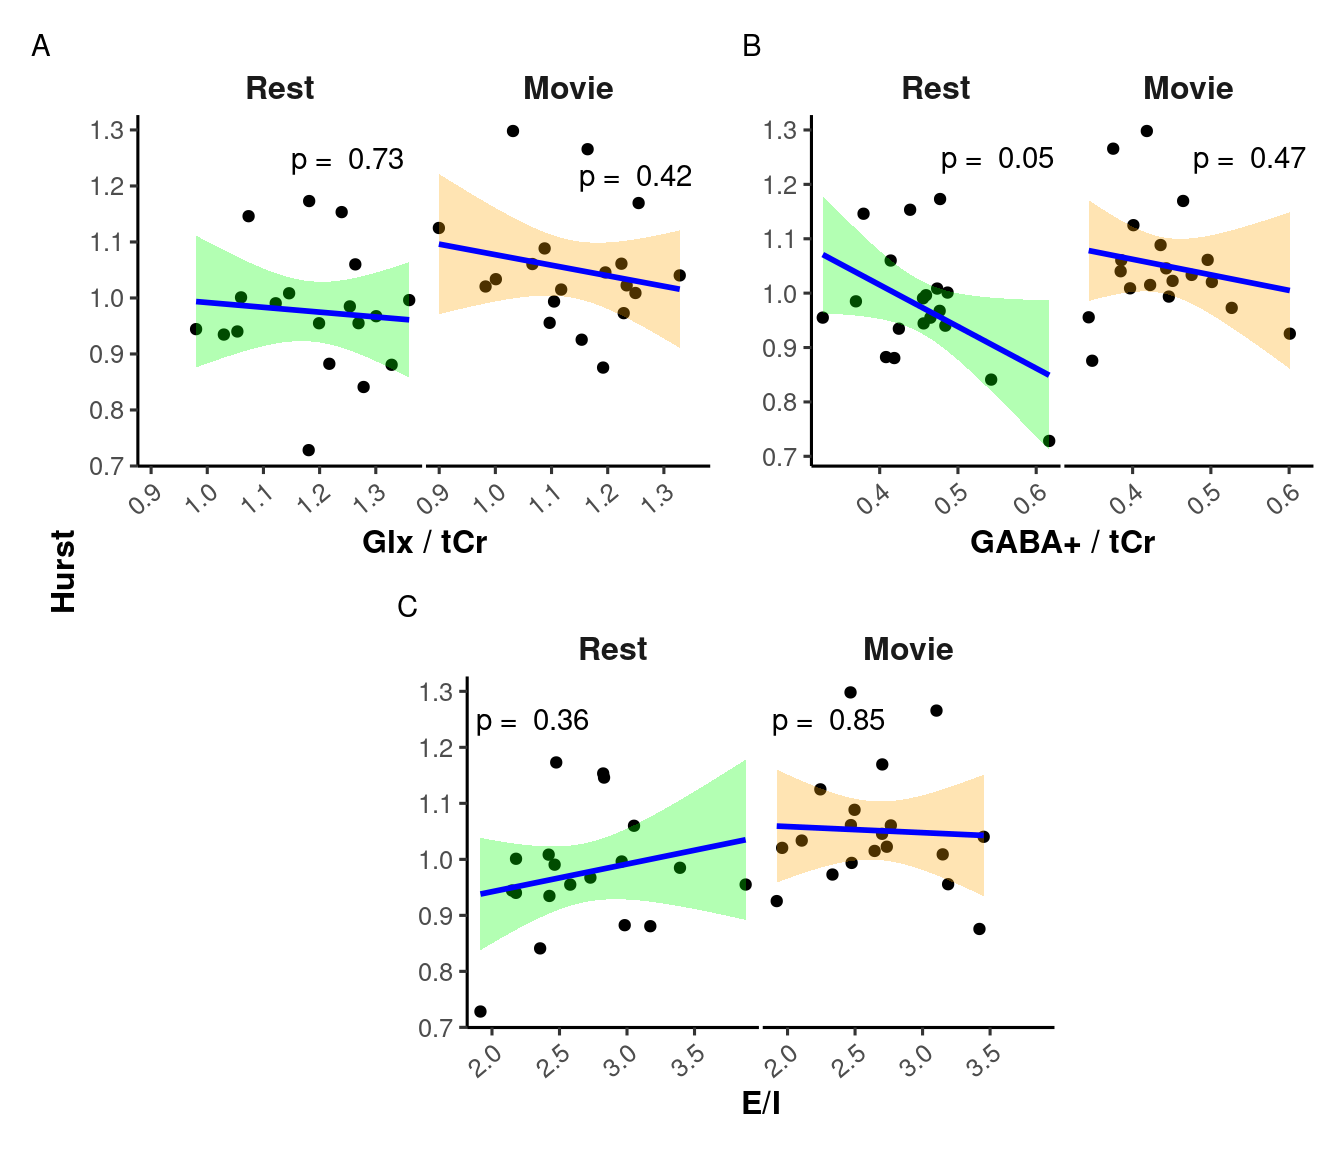
H was not found to correlate with Glx, GABA+, or E:I, during rest or movie (Figure 7).
3.4.1 Data quality
Mean FD was not correlated with H during rest (r = -0.33, p = 0.18) but was moderately negatively correlated with H during movie watching (r = -0.49, p = 0.04; see Supplementary Materials Figure S2 A).
Glx and GABA+ were tested for associations with FWHM values during rest and movie watching. No significant correlations were found (see Supplementary Materials Figure S2 B and C). Glx and GABA+ were tested for associations with frequency shift during rest and movie watching. No significant correlations were found (see Supplementary Materials Figure S2 D and E).
Water FWHM and creatine SNR (CR-SNR) for both sLASER and MEGA-PRESS were analyzed pre- vs. post-fMRI. Supplementary Table S7, Table S8, and Table S9 present the paired t-tests and subject-level rest/movie values, while Supplementary Figure S3 show the individual trajectories. No systematic drifts were detected (all p > 0.2 for FWHM; p > 0.3 for SNR). Furthermore, a group averaged plot of the frequency shift between rest and movie can be found in the Supplementary Materials (Figure S4).
3.5 Re-analysis using Gannet
The re-analysis of our results using only the MEGA-PRESS sequence and Gannet did not result in any significant changes from the results reported above. We have included these results in the Supplementary Material.
4 Discussion
This study provides the first in vivo human investigation of the relationship between H and the E:I ratio, measured using fMRI and MRS-derived glutamate and GABA levels, respectively. No association was observed between H and E:I, suggesting that these indices may reflect distinct dimensions of neural dynamics. During movie-watching, H increased relative to rest, consistent with stronger long-range temporal dependencies in BOLD activity during visual stimulation. In contrast, Glx, GABA+, and their ratio (E:I) remained stable across conditions. These results indicate that functional signal complexity, as indexed by H, is sensitive to sensory engagement but does not appear to covary with MRS-derived estimates of excitatory–inhibitory balance under the current experimental conditions.
An increase in H during movie-watching relative to rest aligns with previous work from our lab35, which reported increased H in the visual network (as defined by Yeo’s seven resting-state networks122) during movie-watching using data from the Human Connectome Project123. While this increase in H is consistent with our prior findings, other studies have reported decreases in H during active tasks33,34,36,124. The current results therefore suggest that the naturalistic, passive nature of movie-watching elicits a different effect on H compared to more active tasks. This interpretation is consistent with evidence indicating distinct neural responses and BOLD signal characteristics between conventional active visual tasks and naturalistic passive visual stimuli35,125. Higher H during movie-watching may reflect richer scaling properties that support the continuous integration of visual stimuli35.
No significant changes were observed in either Glx or GABA+ between conditions. Consequently, the E:I ratio remained stable. The experimental design included both resting and movie-watching conditions to induce measurable differences in H, Glx, and GABA+, providing a wider range of values to test for correlations between these metrics. However, the absence of condition-related differences in Glx and GABA+ complicates interpretation of the null findings. Establishing such changes would have provided a foundation for directly examining the correlation between H and the E:I ratio. Without clear evidence that the paradigm elicited detectable neurochemical variation, it remains uncertain whether the lack of association between H and E:I reflects a genuine independence of these measures or limited sensitivity of the MRS protocol to capture subtle metabolic changes.
A recent meta-analysis of studies measuring Glu and Glx97 reported a minimal task-induced increase in Glu and Glx within the visual cortex, primarily in the context of pain, learning, or motor paradigms rather than visual stimulation. Additionally, many of the studies included were conducted at 7T, offering increased sensitivity for detecting changes in Glu and Glx. Nonetheless, several studies have demonstrated changes in Glu and Glx at 3T126–128. Regarding our GABA+ findings, the same meta-analysis97 reported no task-dependent change in GABA within the visual cortex. This may be attributable to technical difficulties associated with capturing GABA levels using MRS at 3T due to its low concentration and spectral overlap with more abundant metabolites97. Although, several studies have successfully reported changes in GABA at 3T using different paradigms and/or regions of interest129–131.
Another reason changes in Glx or GABA+ may not have been observed could be due to our use of a block-design: collecting 24 minutes of rest data, then collecting 24 minutes of movie-watching data. While a block design has the advantage of a more robust metabolite quantification due to greater signal averaging, brain homeostatis during these long blocks may lead to an erasure of any real metabolic changes128,132. Indeed, Pasanta et al. (2023)97 and Archibald et al. (2020)133 reported larger metabolite changes during event-related paradigms compared to block designs, underscoring how task timing and structure can strongly influence the detectability of metabolic modulation with MRS.
The concept of E:I balance encompasses multiple biological scales and mechanisms beyond neurotransmitter concentrations, including the relative densities of excitatory and inhibitory neurons, synaptic properties, interneuron subtype interactions, and electrophysiological signatures such as 1/f spectral scaling. While the glutamate-to-GABA ratio measured via MRS provides a noninvasive — albeit indirect — estimate of neurochemical E:I balance in humans, it remains a simplification of the underlying complexity. MRS derived values reflect total glutamate and GABA metabolite pools, predominantly intracellular and metabolically active, rather than direct synaptic neurotransmitter release underlying real-time excitation and inhibition. Moreover, conventional MRS measures such as Glx and GABA+ include contributions from glutamine and macromolecules, respectively, limiting their chemical specificity. Therefore, while these metabolites serve as useful proxies related to excitatory and inhibitory neural systems, caution is warranted when interpreting them as direct indices of neurotransmission. Nonetheless, these metabolic pools provide valuable insight into the overall balance of excitation and inhibition within the brain’s microenvironment and remain widely used in human in vivo studies of neural function and dysfunction. Finally, few studies have directly quantified both glutamate and GABA in the same individuals, highlighting the novelty and importance of this approach. Our study acknowledges these limitations and aims to provide a step toward linking neurochemical measures with large-scale brain dynamics related to criticality.
Alternatively, the present findings may in fact indicate that H and E:I are not directly coupled, or that their relationship is more complex than a simple linear association. This would perhaps not be surprising given the large disparity of findings in the literature, especially with regard to the directionality and linearity of the proposed E:I-Hurst relationship6–12 (see Table 3). The heterogeneity across these studies underscores the challenges of studying this phenomenon and suggests that any potential E:I-Hurst relationship may depend on experimental context, data acquisition methods, or analysis strategies. Further work is needed to clarify the true nature of this relationship and the conditions under which it might emerge.
| Citation | Study Type | H Data Type | H Calculation Method | E:I Type | E:I-Hurst Relationship |
|---|---|---|---|---|---|
| Poil et al. (2012)7 | Computational with in-house simulated model | Neuronal avalanche size | Detrendend fluctuation analysis (DFA) | Structural: number of E-to-I neurons | Inverse U |
| Bruining et al. (2020)10 | Computational with model by Poil et al. (2012); modified in-house | Neuronal oscillation amplitude | DFA | Structural: number of E-to-I synapses | Inverse U |
| Gao et al. (2017)12 | Computational; in vivo in rats and macaques | Local field potential (LFP) | PSD | Estimated from LFP | Positive linear |
| Lombardi et al. (2017)8 | Computational with in-house model | Neuronal avalanche size | PSD | Structural: number of E-to-I neurons | Negative linear |
| Trakoshis et al. (2020)11 | Computational with simulated data; in vivo in mice | fMRI BOLD signal | Wavelet-based maximum likelihood method | E-to-I synaptic conductance | Negative linear |
Our findings specifically show an absence of a robust association between the Hurst exponent and MRS-derived E:I ratio, challenging the assumption that these measures directly reflect a shared underlying mechanism, such as the brain’s distance from criticality. One possibility is that while both H and E:I may independently vary with neural excitability, their relationship is nonlinear or not detectable at the temporal and spatial scales of fMRI and MRS. Additionally, the E:I balance estimated via glutamate and GABA concentrations may reflect metabolic rather than synaptic activity, limiting its correspondence with network dynamics captured by BOLD signal autocorrelation. These results have important implications for studies that use H as a proxy for E:I, particularly in neurodevelopmental or neurodegenerative contexts, and suggest caution in interpreting H as a stand-in for neurochemical balance without direct validation. Future research should investigate whether the relationship emerges under task-driven conditions, in specific brain regions, or in populations with pronounced E:I dysregulation.
Finally, it is also possible that while an E:I-Hurst relationship exists, it is not observed within the visual cortex. This theory seems plausible given that MRS studies of disrupted E:I, mostly conducted within the context of autistic adults, have found changes in E:I within other brain regions such as the anterior cingulate cortex, frontal lobe, or temporal lobe53. Moreover, findings with reference to changes in excitatory or inhibitory neurotransmitters within the visual cortex tend to be difficult to capture, perhaps indicating that E:I shows less changes in this region97. However, this would suggest that the E:I-H relationship would be region dependent, and therefore not a global theory as it is often portrayed.
As both H and E:I have been known to change with age, we did not seek to limit our sample to any specific age range. Furthermore, other physiological details — such as caffeine, nicotine, phase of the menstrual cycle, gender, and medication use — were not collected, as the core E:I-Hurst theory posits a global relationship that should hold irrespective of specific brain states or transient physiological factors. Additionally, our within-subjects design strengthens this approach: our core analyses assessing changes between resting state and movie-watching were paired, with each participant serving as their own control. This reduces the influence of inter-individual variability, including age-related and other brain-state effects.
4.1 Limitations and Strengths
Beyond the limitations already mentioned (field strength, visual cortex, passive task, block design), another limitation was our small sample size. As this was a pilot study, 26 participants were initially scanned. Once individuals were excluded for poor MRI quality, only 18 participants’ data were analyzed. With this small sample size, it is difficult to make conclusions about a concept as complex as the E:I-Hurst relationship.
It is also important to note that MRS measures reflect total glutamate and GABA metabolite pools, predominantly intracellular and involved in metabolic processes, rather than direct synaptic neurotransmitter release. Furthermore, commonly used measures such as Glx and GABA+ include signals from glutamine and macromolecules, respectively, limiting their chemical specificity. Therefore, while these metabolites serve as useful proxies related to excitatory and inhibitory neural systems, caution is warranted when interpreting them as direct indices of neurotransmission. Nonetheless, these metabolic pools provide valuable insight into the overall balance of excitation and inhibition within the brain’s microenvironment and remain widely used in human in vivo studies of neural function and dysfunction. Although voxel placement was guided by anatomical landmarks and performed by trained personnel, some variability in voxel location across subjects and sessions may have introduced noise in metabolite quantification. Future studies may benefit from automated alignment and formal voxel overlap analysis to reduce this source of variability. Furthermore, our MRS voxels were placed once for the first MRS sequence, and copied for the subsequent MRS runs. This ‘cloning’ assumes nominal stability and does not capture any potential effective sampling differences due to head motion or shim-related changes. Future studies may also wish to acquire high resolution anatomical scans before each MRS run in order to re-align the MRS voxel and to quantify: intra-subject voxel movement; voxel dice coefficient: overlap of runs (ideally >0.90); center-of-mass distance: Euclidean shift (mm) between runs (e.g. threshold >5mm outlier). We did not explicitly monitor scanner frequency drift following the fMRI runs. Heating-related drift can affect the stability of MRS sequences, potentially introducing variability in glutamate and GABA quantification134. While all MRS data were visually inspected for quality, we cannot rule out subtle effects of drift, which may have contributed to noise in the E:I measurements. We included frequency drift in our linear mixed-effects models in an attempt to control for these confounds. For future research, we highly recommend prospective drift corrections to address these issues. Finally, the order of scanning conditions (rest followed by movie-watching) was not pseudorandomized. This may introduce potential order-related confounds, such as physiological adaptation or scanner drift, which could influence the observed differences between conditions.
An additional avenue for future research involves dynamic fMRS, which seeks to capture time-varying changes in metabolite levels during task performance. While promising, such approaches currently face substantial limitations in signal-to-noise ratio and temporal resolution, particularly for edited GABA measures. Our study was not optimized for dynamic fitting, but future work could explore how fluctuations in neurometabolites relate to moment-to-moment variations in BOLD signal complexity.
We hope that by future researchers can use our reported effect sizes to calculate potential sample sizes. We would also like to list some of the strengths of our study, which include: using sLASER (as opposed to PRESS), which has been shown to have enhanced detection of complex multiplets such as Glx/Glu78; using the J-editing sequence MEGA-PRESS for improved GABA detection56; using a large MRS voxel size (~22 ml) as per consensus recommendations135–137; measuring H within the same region as our single-voxel MRS; and using multi-echo fMRI for improved motion artifact regression138.
4.2 Lessons for Future Researchers
Finally, we hope that we can provide some guidance to future researchers. The following is a non-exhaustive list of suggestions for future work:
- future studies should consider using ultra-high-field 7T MRI, which provides improved spectral resolution and more reliable detection of Glu and GABA compared to conventional 3T MRI139;
- examining paradigms that have consistently demonstrated alterations in these metabolites, such as pain studies, may enhance the likelihood of detecting changes in Glu and GABA126,127,133.
- exploring brain regions beyond the visual cortex, such as the anterior cingulate cortex, which is commonly implicated in pain processing133,140–142;
- including a more diverse participant sample — beyond healthy controls — may help capture a wider range of H and E:I values, potentially improving sensitivity to metabolite-related changes;
- increasing sample size in order to detect small effect sizes;
- using an event-related design, as opposed to the block design we used, may provide more sensitivity to detecting rapid and transient neural responses due to its ability to isolate specific events within the scan session143. However, see Pasanta et al. (2023)97 for a longer discussion and possible downsides to this approach;
- and finally, using a combined fMRI-MRS sequence77,144 to measure BOLD and Glu/GABA near-simultaneously.
Together, these considerations may help in overcoming the limitations observed in the present study and contribute to a clearer understanding of the potential relationship between E:I and H.
5 Conclusion
In conclusion, the results do not support a relationship between H and the E:I ratio in the visual cortex either during rest or during movie-watching at 3T in humans. Although a task-related increase in H was observed, no accompanying changes were detected in Glu, GABA, or E:I between movie and rest. Comparing our findings to the broader literature, E:I balance may be too subtle to be detected with conventional 3T MRS methods139. Therefore, higher-field (7T) or multi-voxel fMRS studies would be needed to confirm. With regards to the broader E:I-Hurst relationship, we similarly suggest that either this relationship is insufficiently captured with our methods, or that the relationship between these two variables may be more complex than originally envisaged — perhaps they are not directly related, but rather connected through other mediating variables in a non-linear fashion. To our knowledge, this is the first in vivo human study to test for this relationship. It is our hope that as the literature grows, more authors will examine this relationship with respect to other brain regions and using other methods, and will use the lessons learned in this study to inform their own. Hopefully then it will be possible to corroborate findings to probe the complex relationships that may exist with regards to H and E:I in the human brain.
Data availability statement
All code used in this paper is available at github.com/WeberLab/EI_Hurst_Analysis. The raw MRI data used in this paper is available by contacting the author. The manuscript was written in a ‘reproducible manner’: the entire manuscript, including statistics reported, figures, and tables, can be reproduced here: weberlab.github.io/EI_Hurst_Manuscript/
Competing interests
The authors declare they have no known competing interests.
Acknowledgements
The work presented in this paper was supported in part from funding from the British Columbia Children’s Hospital Foundation, and an NSERC Discovery Grant.
References
1.
Deco, G., Jirsa, V. K. & McIntosh, A. R. Resting brains never rest: Computational insights into potential cognitive architectures. Trends in Neurosciences 36, 268–274 (2013).
2.
Beggs, J. & Timme, N. Being Critical of Criticality in the Brain. Frontiers in Physiology 3, (2012).
3.
Baranger, M. Chaos, Complexity, and Entropy: A physics talk for non-physicists. New England Complex Systems Institute (2000).
4.
Bassett, D. S. & Gazzaniga, M. S. Understanding complexity in the human brain. Trends in cognitive sciences 15, 200–209 (2011).
5.
Zimmern, V. Why Brain Criticality Is Clinically Relevant: A Scoping Review. Frontiers in Neural Circuits 14, (2020).
6.
Liang, J., Yang, Z. & Zhou, C. Excitation–Inhibition Balance, Neural Criticality, and Activities in Neuronal Circuits. The Neuroscientist 10738584231221766 (2024) doi:10.1177/10738584231221766.
7.
Poil, S.-S., Hardstone, R., Mansvelder, H. D. & Linkenkaer-Hansen, K. Critical-State Dynamics of Avalanches and Oscillations Jointly Emerge from Balanced Excitation/Inhibition in Neuronal Networks. Journal of Neuroscience 32, 9817–9823 (2012).
8.
Lombardi, F., Herrmann, H. J. & de Arcangelis, L. Balance of excitation and inhibition determines 1/f power spectrum in neuronal networks. Chaos: An Interdisciplinary Journal of Nonlinear Science 27, 047402 (2017).
9.
Baumgarten, L. & Bornholdt, S. Critical excitation-inhibition balance in dense neural networks. Physical Review E 100, 010301 (2019).
10.
Bruining, H. et al. Measurement of excitation-inhibition ratio in autism spectrum disorder using critical brain dynamics. Scientific Reports 10, 9195 (2020).
11.
Trakoshis, S. et al. Intrinsic excitation-inhibition imbalance affects medial prefrontal cortex differently in autistic men versus women. eLife 9, e55684 (2020).
12.
Gao, R., Peterson, E. J. & Voytek, B. Inferring synaptic excitation/inhibition balance from field potentials. NeuroImage 158, 70–78 (2017).
13.
Tian, Y. et al. Theoretical foundations of studying criticality in the brain. Network Neuroscience 6, 1148–1185 (2022).
14.
Rubinov, M., Sporns, O., Thivierge, J.-P. & Breakspear, M. Neurobiologically Realistic Determinants of Self-Organized Criticality in Networks of Spiking Neurons. PLOS Computational Biology 7, e1002038 (2011).
15.
Langton, C. G. Computation at the edge of chaos: Phase transitions and emergent computation. Physica D: Nonlinear Phenomena 42, 12–37 (1990).
16.
Bak, P. How Nature Works. (Springer, New York, NY, 1996). doi:10.1007/978-1-4757-5426-1.
17.
Rubenstein, J. L. R. & Merzenich, M. M. Model of autism: Increased ratio of excitation/inhibition in key neural systems. Genes, brain, and behavior 2, 255–267 (2003).
18.
Lauterborn, J. C. et al. Increased excitatory to inhibitory synaptic ratio in parietal cortex samples from individuals with Alzheimer’s disease. Nature Communications 12, 2603 (2021).
19.
Sohal, V. S. & Rubenstein, J. L. R. Excitation-inhibition balance as a framework for investigating mechanisms in neuropsychiatric disorders. Molecular Psychiatry 24, 1248–1257 (2019).
20.
Muñoz, M. A. Colloquium : Criticality and dynamical scaling in living systems. Reviews of Modern Physics 90, 031001 (2018).
21.
Caserta, F. et al. Determination of fractal dimension of physiologically characterized neurons in two and three dimensions. Journal of Neuroscience Methods 56, 133–144 (1995).
22.
Lowen, S. B., Cash, S. S., Poo, M. & Teich, M. C. Quantal Neurotransmitter Secretion Rate Exhibits Fractal Behavior. The Journal of Neuroscience 17, 5666–5677 (1997).
23.
Mazzoni, A. et al. On the Dynamics of the Spontaneous Activity in Neuronal Networks. PLoS ONE 2, e439 (2007).
24.
Bédard, C. & Destexhe, A. Macroscopic Models of Local Field Potentials and the Apparent 1/f Noise in Brain Activity. Biophysical Journal 96, 2589–2603 (2009).
25.
Bullmore, E. T. et al. Fractal analysis of electroencephalographic signals intracerebrally recorded during 35 epileptic seizures: Evaluation of a new method for synoptic visualisation of ictal events. Electroencephalography and Clinical Neurophysiology 91, 337–345 (1994).
26.
Zarahn, E., Aguirre, G. K. & D’Esposito, M. Empirical Analyses of BOLD fMRI Statistics. NeuroImage 5, 179–197 (1997).
27.
Fadili, M. J. & Bullmore, E. T. Wavelet-Generalized Least Squares: A New BLU Estimator of Linear Regression Models with 1/f Errors. NeuroImage 15, 217–232 (2002).
28.
Campbell, O. L. & Weber, A. M. Monofractal analysis of functional magnetic resonance imaging: An introductory review. Human Brain Mapping 43, 2693–2706 (2022).
29.
Eke, A., Herman, P., Kocsis, L. & Kozak, L. R. Fractal characterization of complexity in temporal physiological signals. Physiological Measurement 23, R1–38 (2002).
30.
Hurst, H. E. Long-Term Storage Capacity of Reservoirs. Transactions of the American Society of Civil Engineers 116, 770–799 (1951).
31.
Dong, J. et al. Hurst Exponent Analysis of Resting-State fMRI Signal Complexity across the Adult Lifespan. Frontiers in Neuroscience 12, (2018).
32.
Wink, A.-M., Bullmore, E., Barnes, A., Bernard, F. & Suckling, J. Monofractal and multifractal dynamics of low frequency endogenous brain oscillations in functional MRI. Human Brain Mapping 29, 791–801 (2008).
33.
Ciuciu, P., Abry, P. & He, B. J. Interplay between functional connectivity and scale-free dynamics in intrinsic fMRI networks. NeuroImage 95, 248–263 (2014).
34.
He, B. J. Scale-Free Properties of the Functional Magnetic Resonance Imaging Signal during Rest and Task. Journal of Neuroscience 31, 13786–13795 (2011).
35.
Campbell, O., Vanderwal, T. & Weber, A. M. Fractal-Based Analysis of fMRI BOLD Signal During Naturalistic Viewing Conditions. Frontiers in Physiology 12, (2022).
36.
Churchill, N. W. et al. The suppression of scale-free fMRI brain dynamics across three different sources of effort: Aging, task novelty and task difficulty. Scientific Reports 6, 30895 (2016).
37.
Wink, A. M., Bernard, F., Salvador, R., Bullmore, E. & Suckling, J. Age and cholinergic effects on hemodynamics and functional coherence of human hippocampus. Neurobiology of Aging 27, 1395–1404 (2006).
38.
Mella, A. E., Vanderwal, T., Miller, S. P. & Weber, A. M. Temporal complexity of the BOLD-signal in preterm versus term infants. Cerebral Cortex 34, bhae426 (2024).
39.
Maxim, V. et al. Fractional Gaussian noise, functional MRI and Alzheimer’s disease. NeuroImage 25, 141–158 (2005).
40.
Warsi, M. A., Molloy, W. & Noseworthy, M. D. Correlating brain blood oxygenation level dependent (BOLD) fractal dimension mapping with magnetic resonance spectroscopy (MRS) in Alzheimer’s disease. Magnetic Resonance Materials in Physics, Biology and Medicine 25, 335–344 (2012).
41.
Dona, O., Hall, G. B. & Noseworthy, M. D. Temporal fractal analysis of the rs-BOLD signal identifies brain abnormalities in autism spectrum disorder. PLOS ONE 12, e0190081 (2017).
42.
Lai, M.-C. et al. A Shift to Randomness of Brain Oscillations in People with Autism. Biological Psychiatry 68, 1092–1099 (2010).
43.
Linke, A. C. et al. Altered Development of the Hurst Exponent in the Medial Prefrontal Cortex in Preschoolers With Autism. Biological Psychiatry: Cognitive Neuroscience and Neuroimaging S2451902224002714 (2024) doi:10.1016/j.bpsc.2024.09.003.
44.
Uscătescu, L. C. et al. Using the Excitation/Inhibition Ratio to Optimize the Classification of Autism and Schizophrenia. 2022.05.24.22275531 (2023) doi:10.1101/2022.05.24.22275531.
45.
Dona, O., Noseworthy, M. D., DeMatteo, C. & Connolly, J. F. Fractal Analysis of Brain Blood Oxygenation Level Dependent (BOLD) Signals from Children with Mild Traumatic Brain Injury (mTBI). PLOS ONE 12, e0169647 (2017).
46.
Wei, M. et al. Identifying major depressive disorder using Hurst exponent of resting-state brain networks. Psychiatry Research: Neuroimaging 214, 306–312 (2013).
47.
Jing, B. et al. Identifying current and remitted major depressive disorder with the Hurst exponent: A comparative study on two automated anatomical labeling atlases. Oncotarget 8, 90452–90464 (2017).
48.
Sokunbi, M. O. et al. Nonlinear Complexity Analysis of Brain fMRI Signals in Schizophrenia. PLoS ONE 9, e95146 (2014).
49.
Vico Varela, E., Etter, G. & Williams, S. Excitatory-inhibitory imbalance in Alzheimer’s disease and therapeutic significance. Neurobiology of Disease 127, 605–615 (2019).
50.
Uzunova, G., Pallanti, S. & Hollander, E. Excitatory/inhibitory imbalance in autism spectrum disorders: Implications for interventions and therapeutics. The World Journal of Biological Psychiatry 17, 174–186 (2016).
51.
Page, C. E. & Coutellier, L. Prefrontal excitatory/inhibitory balance in stress and emotional disorders: Evidence for over-inhibition. Neuroscience & Biobehavioral Reviews 105, 39–51 (2019).
52.
Kang, E. et al. Interplay between a Mental Disorder Risk Gene and Developmental Polarity Switch of GABA Action Leads to Excitation-Inhibition Imbalance. Cell Reports 28, 1419–1428.e3 (2019).
53.
Ajram, L. A. et al. The contribution of [1H] magnetic resonance spectroscopy to the study of excitation-inhibition in autism. Progress in Neuro-Psychopharmacology and Biological Psychiatry 89, 236–244 (2019).
54.
Stanley, J. A. & Raz, N. Functional Magnetic Resonance Spectroscopy: The “New” MRS for Cognitive Neuroscience and Psychiatry Research. Frontiers in Psychiatry 9, 76 (2018).
55.
Harris, A. D., Saleh, M. G. & Edden, R. A. E. Edited 1 H magnetic resonance spectroscopy in vivo: Methods and metabolites. Magnetic Resonance in Medicine 77, 1377–1389 (2017).
56.
Peek, A. L. et al. A comprehensive guide to MEGA-PRESS for GABA measurement. Analytical Biochemistry 669, 115113 (2023).
57.
Poil, S.-S. et al. Fast network oscillations in vitro exhibit a slow decay of temporal auto-correlations: Stability of fast network oscillations. European Journal of Neuroscience 34, 394–403 (2011).
58.
Monto, S., Vanhatalo, S., Holmes, M. D. & Palva, J. M. Epileptogenic Neocortical Networks Are Revealed by Abnormal Temporal Dynamics in Seizure-Free Subdural EEG. Cerebral Cortex 17, 1386–1393 (2007).
59.
Beggs, J. M. & Plenz, D. Neuronal Avalanches in Neocortical Circuits. The Journal of Neuroscience 23, 11167–11177 (2003).
60.
Gireesh, E. D. & Plenz, D. Neuronal avalanches organize as nested theta- and beta/gamma-oscillations during development of cortical layer 2/3. Proceedings of the National Academy of Sciences 105, 7576–7581 (2008).
61.
Yang, H., Shew, W. L., Roy, R. & Plenz, D. Maximal Variability of Phase Synchrony in Cortical Networks with Neuronal Avalanches. The Journal of Neuroscience 32, 1061–1072 (2012).
62.
O’Byrne, J. & Jerbi, K. How critical is brain criticality? Trends in Neurosciences 45, 820–837 (2022).
63.
Plenz, D. et al. Self-Organized Criticality in the Brain. Frontiers in Physics 9, 639389 (2021).
64.
Avrămiea, A.-E. Regulation of critical brain dynamics and its functional implications. HFAAA72020230307 (Vrije Universiteit Amsterdam, 2023). doi:10.5463/thesis.144.
65.
Zeraati, R., Priesemann, V. & Levina, A. Self-Organization Toward Criticality by Synaptic Plasticity. Frontiers in Physics 9, 619661 (2021).
66.
Ikeda, N., Akita, D. & Takahashi, H. Emergent functions of noise-driven spontaneous activity: Homeostatic maintenance of criticality and memory consolidation. (2025).
67.
Xie, K. et al. Pharmaco-resistant temporal lobe epilepsy gradually perturbs the cortex-wide excitation-inhibition balance. (2024) doi:10.1101/2024.04.22.590555.
68.
Fotiadis, P. et al. Myelination and excitation-inhibition balance synergistically shape structure-function coupling across the human cortex. Nature Communications 14, 6115 (2023).
69.
Vanderwal, T., Eilbott, J. & Castellanos, F. X. Movies in the magnet: Naturalistic paradigms in developmental functional neuroimaging. Developmental Cognitive Neuroscience 36, 100600 (2019).
70.
Lin, Y., Stephenson, M. C., Xin, L., Napolitano, A. & Morris, P. G. Investigating the Metabolic Changes due to Visual Stimulation using Functional Proton Magnetic Resonance Spectroscopy at 7 T. Journal of Cerebral Blood Flow & Metabolism 32, 1484–1495 (2012).
71.
Martínez-Maestro, M., Labadie, C. & Möller, H. E. Dynamic metabolic changes in human visual cortex in regions with positive and negative blood oxygenation level-dependent response. Journal of Cerebral Blood Flow and Metabolism: Official Journal of the International Society of Cerebral Blood Flow and Metabolism 39, 2295–2307 (2019).
72.
Saucedo, A., Guo, F., Pappas, I. & Wang, D. Changes in GABA and Glutamate levels with peripheral and central visual stimulation using functional magnetic resonance spectroscopy at 7T. in 2024 ISMRM & ISMRT Annual Meeting 1922 (Toronto, ON, Canada). doi:10.58530/2024/1922.
73.
Kurcyus, K. et al. Opposite Dynamics of GABA and Glutamate Levels in the Occipital Cortex during Visual Processing. The Journal of Neuroscience 38, 9967–9976 (2018).
74.
Oz, G. & Tkáč, I. Short-echo, single-shot, full-intensity proton magnetic resonance spectroscopy for neurochemical profiling at 4 T: Validation in the cerebellum and brainstem. Magnetic Resonance in Medicine 65, 901–910 (2011).
75.
Mescher, M., Merkle, H., Kirsch, J., Garwood, M. & Gruetter, R. Simultaneous in vivo spectral editing and water suppression. NMR in biomedicine 11, 266–272 (1998).
76.
Cordey, H. Jungles. Our Planet (2019).
77.
Ip, I. B. et al. Combined fMRI-MRS acquires simultaneous glutamate and BOLD-fMRI signals in the human brain. NeuroImage 155, 113–119 (2017).
78.
Wilson, M. et al. Methodological consensus on clinical proton MRS of the brain: Review and recommendations. Magnetic Resonance in Medicine 82, 527–550 (2019).
79.
Van Veenendaal, T. M. et al. Glutamate quantification by PRESS or MEGA-PRESS: Validation, repeatability, and concordance. Magnetic Resonance Imaging 48, 107–114 (2018).
80.
Li, X., Morgan, P. S., Ashburner, J., Smith, J. & Rorden, C. The first step for neuroimaging data analysis: DICOM to NIfTI conversion. Journal of Neuroscience Methods 264, 47–56 (2016).
81.
Gorgolewski, K. J. et al. The brain imaging data structure, a format for organizing and describing outputs of neuroimaging experiments. Scientific Data 3, 160044 (2016).
82.
Boré, A., Guay, S., Bedetti, C., Meisler, S. & GuenTher, N. Dcm2Bids. (2023) doi:10.5281/zenodo.8436509.
83.
Tustison, N. J. et al. N4ITK: Improved N3 Bias Correction. IEEE Transactions on Medical Imaging 29, 1310–1320 (2010).
84.
Avants, B. B., Epstein, C. L., Grossman, M. & Gee, J. C. Symmetric diffeomorphic image registration with cross-correlation: Evaluating automated labeling of elderly and neurodegenerative brain. Medical Image Analysis 12, 26–41 (2008).
85.
Gorgolewski, K. J. et al. Nipype: A flexible, lightweight and extensible neuroimaging data processing framework in Python. 0.12.0-Rc1. (2016) doi:10.5281/zenodo.50186.
86.
Zhang, Y., Brady, M. & Smith, S. Segmentation of brain MR images through a hidden Markov random field model and the expectation-maximization algorithm. IEEE Transactions on Medical Imaging 20, 45–57 (2001).
87.
Smith, S. M. et al. Advances in functional and structural MR image analysis and implementation as FSL. NeuroImage 23 Suppl 1, S208–219 (2004).
88.
Dale, A. M., Fischl, B. & Sereno, M. I. Cortical surface-based analysis. I. Segmentation and surface reconstruction. NeuroImage 9, 179–194 (1999).
89.
Klein, A. et al. Mindboggling morphometry of human brains. PLoS computational biology 13, e1005350 (2017).
90.
Esteban, O. et al. fMRIPrep: A robust preprocessing pipeline for functional MRI. Nature Methods 16, 111–116 (2019).
91.
Jenkinson, M., Bannister, P., Brady, M. & Smith, S. Improved optimization for the robust and accurate linear registration and motion correction of brain images. NeuroImage 17, 825–841 (2002).
92.
Cox, R. W. AFNI: Software for Analysis and Visualization of Functional Magnetic Resonance Neuroimages. Computers and Biomedical Research 29, 162–173 (1996).
93.
Posse, S. et al. Enhancement of BOLD-contrast sensitivity by single-shot multi-echo functional MR imaging. Magnetic Resonance in Medicine 42, 87–97 (1999).
94.
DuPre, E. et al. TE-dependent analysis of multi-echo fMRI with *tedana*. Journal of Open Source Software 6, 3669 (2021).
95.
Oeltzschner, G. et al. Osprey: Open-Source Processing, Reconstruction & Estimation of Magnetic Resonance Spectroscopy Data. Journal of neuroscience methods 343, 108827 (2020).
96.
Provencher, S. W. Automatic quantitation of localized in vivo 1H spectra with LCModel. NMR in biomedicine 14, 260–264 (2001).
97.
Pasanta, D. et al. Functional MRS studies of GABA and glutamate/Glx – A systematic review and meta-analysis. Neuroscience & Biobehavioral Reviews 144, 104940 (2023).
98.
Ramadan, S., Lin, A. & Stanwell, P. Glutamate and Glutamine: A Review of In Vivo MRS in the Human Brain. NMR in biomedicine 26, 10.1002/nbm.3045 (2013).
99.
Zöllner, H. J. et al. Comparison of different linear-combination modeling algorithms for short-TE proton spectra. NMR in biomedicine 34, e4482 (2021).
100.
Zöllner, H. J. et al. Comparison of linear combination modeling strategies for edited magnetic resonance spectroscopy at 3 T. NMR in biomedicine 35, e4618 (2022).
101.
An, L., Willem Van Der Veen, J., Li, S., Thomasson, D. M. & Shen, J. Combination of multichannel single-voxel MRS signals using generalized least squares. Journal of Magnetic Resonance Imaging 37, 1445–1450 (2013).
102.
Bouchard, A. E. & Mikkelsen, M. Noise decorrelation coil combination optimizes SNR of edited 1H MRS data. Magnetic Resonance Imaging 122, 110452 (2025).
103.
Harris, A. D., Puts, N. A. J., Barker, P. B. & Edden, R. A. E. Spectral-Editing Measurements of GABA in the Human Brain with and without Macromolecule Suppression. Magnetic resonance in medicine 74, 1523–1529 (2015).
104.
Mikkelsen, M. et al. Big GABA II: Water-referenced edited MR spectroscopy at 25 research sites. NeuroImage 191, 537–548 (2019).
105.
Mikkelsen, M. et al. Big GABA: Edited MR spectroscopy at 24 research sites. NeuroImage 159, 32–45 (2017).
106.
Friston, K., Ashburner, J., Kiebel, S., Nichols, T. & Penny, W. Statistical Parametric Mapping: The Analysis of Functional Brain Images. (Elsevier Ltd., 2007).
107.
Gasparovic, C. et al. Use of tissue water as a concentration reference for proton spectroscopic imaging. Magnetic Resonance in Medicine 55, 1219–1226 (2006).
108.
Rideaux, R. No balance between glutamate+glutamine and GABA+ in visual or motor cortices of the human brain: A magnetic resonance spectroscopy study. NeuroImage 237, 118191 (2021).
109.
Juchem, C. et al. B0 shimming for in vivo magnetic resonance spectroscopy: Experts’ consensus recommendations. NMR in Biomedicine 34, e4350 (2021).
110.
Edden, R. A. E., Puts, N. A. J., Harris, A. D., Barker, P. B. & Evans, C. J. Gannet: A batch-processing tool for the quantitative analysis of gamma-aminobutyric acid–edited MR spectroscopy spectra. Journal of Magnetic Resonance Imaging 40, 1445–1452 (2014).
111.
Duff, E. P. et al. The power of spectral density analysis for mapping endogenous BOLD signal fluctuations. Human Brain Mapping 29, 778–790 (2008).
112.
Bullmore, E. et al. Wavelets and functional magnetic resonance imaging of the human brain. NeuroImage 23, S234–S249 (2004).
113.
Welch, P. The use of fast Fourier transform for the estimation of power spectra: A method based on time averaging over short, modified periodograms. IEEE Transactions on Audio and Electroacoustics 15, 70–73 (1967).
114.
Virtanen, P. et al. SciPy 1.0: Fundamental algorithms for scientific computing in Python. Nature Methods 17, 261–272 (2020).
115.
Rubin, D., Fekete, T. & Mujica-Parodi, L. R. Optimizing Complexity Measures for fMRI Data: Algorithm, Artifact, and Sensitivity. PLoS ONE 8, e63448 (2013).
116.
Schaefer, A., Brach, J. S., Perera, S. & Sejdić, E. A comparative analysis of spectral exponent estimation techniques for 1/f\(\beta\) processes with applications to the analysis of stride interval time series. Journal of neuroscience methods 222, 118–130 (2014).
117.
Hartmann, A. et al. Real-time fractal signal processing in the time domain. Physica A: Statistical Mechanics and its Applications 392, 89–102 (2013).
118.
Eke, A. et al. Physiological time series: Distinguishing fractal noises from motions. Pflügers Archiv - European Journal of Physiology 439, 403–415 (2000).
119.
Team, R. C. R: A language and environment for statistical computing. (2021).
120.
Student. The Probable Error of a Mean. Biometrika 6, 1–25 (1908).
121.
Freedman, D., Pisani, R. & Purves, R. Statistics. vol. 4 (W. W. Norton & Company, New York, 2007).
122.
Thomas Yeo, B. T. et al. The organization of the human cerebral cortex estimated by intrinsic functional connectivity. Journal of Neurophysiology 106, 1125–1165 (2011).
123.
Van Essen, D. C. et al. The Human Connectome Project: A data acquisition perspective. NeuroImage 62, 2222–2231 (2012).
124.
Barnes, A., Bullmore, E. T. & Suckling, J. Endogenous Human Brain Dynamics Recover Slowly Following Cognitive Effort. PLoS ONE 4, e6626 (2009).
125.
Hasson, U., Malach, R. & Heeger, D. J. Reliability of cortical activity during natural stimulation. Trends in Cognitive Sciences 14, 40–48 (2010).
126.
Gutzeit, A. et al. Differential NMR spectroscopy reactions of anterior/posterior and right/left insular subdivisions due to acute dental pain. European Radiology 23, 450–460 (2013).
127.
Cleve, M., Gussew, A., Wagner, G., Bär, K.-J. & Reichenbach, J. R. Assessment of intra- and inter-regional interrelations between GABA+, Glx and BOLD during pain perception in the human brain - A combined 1H fMRS and fMRI study. Neuroscience 365, 125–136 (2017).
129.
Floyer-Lea, A., Wylezinska, M., Kincses, T. & Matthews, P. M. Rapid Modulation of GABA Concentration in Human Sensorimotor Cortex During Motor Learning. Journal of Neurophysiology 95, 1639–1644 (2006).
130.
Sampaio-Baptista, C. et al. Changes in functional connectivity and GABA levels with long-term motor learning. NeuroImage 106, 15–20 (2015).
131.
Stagg, C. J., Bachtiar, V. & Johansen-Berg, H. The Role of GABA in Human Motor Learning. Current Biology 21, 480–484 (2011).
132.
Mangia, S., Giove, F. & Dinuzzo, M. Metabolic pathways and activity-dependent modulation of glutamate concentration in the human brain. Neurochemical Research 37, 2554–2561 (2012).
133.
Archibald, J. et al. Metabolite activity in the anterior cingulate cortex during a painful stimulus using functional MRS. Scientific Reports 10, 19218 (2020).
134.
Hui, S. C. N. et al. Frequency drift in MR spectroscopy at 3T. NeuroImage 241, 118430 (2021).
135.
Peek, A. L. et al. Brain GABA and glutamate levels across pain conditions: A systematic literature review and meta-analysis of 1H-MRS studies using the MRS-Q quality assessment tool. NeuroImage 210, 116532 (2020).
136.
Choi, I.-Y. et al. Spectral editing in 1H magnetic resonance spectroscopy: Experts’ consensus recommendations. NMR in Biomedicine 34, e4411 (2021).
137.
Lin, A. et al. Minimum Reporting Standards for in vivo Magnetic Resonance Spectroscopy (MRSinMRS): Experts’ consensus recommendations. NMR in biomedicine 34, e4484 (2021).
138.
Kundu, P. et al. Multi-echo fMRI: A review of applications in fMRI denoising and analysis of BOLD signals. NeuroImage 154, 59–80 (2017).
139.
Terpstra, M. et al. Test-retest reproducibility of neurochemical profiles with short-echo, single-voxel MR spectroscopy at 3T and 7T. Magnetic Resonance in Medicine 76, 1083–1091 (2016).
140.
Mullins, P. G., Rowland, L. M., Jung, R. E. & Sibbitt, W. L. A novel technique to study the brain’s response to pain: Proton magnetic resonance spectroscopy. NeuroImage 26, 642–646 (2005).
141.
Gussew, A. et al. Time-resolved functional 1H MR spectroscopic detection of glutamate concentration changes in the brain during acute heat pain stimulation. NeuroImage 49, 1895–1902 (2010).
142.
Gutzeit, A. et al. Insula-specific responses induced by dental pain. A proton magnetic resonance spectroscopy study. European Radiology 21, 807–815 (2011).
143.
Mullins, P. G. Towards a theory of functional magnetic resonance spectroscopy (fMRS): A meta-analysis and discussion of using MRS to measure changes in neurotransmitters in real time. Scandinavian Journal of Psychology 59, 91–103 (2018).
144.
Dwyer, G. E. et al. Simultaneous Measurement of the BOLD Effect and Metabolic Changes in Response to Visual Stimulation Using the MEGA-PRESS Sequence at 3 T. Frontiers in Human Neuroscience 15, 644079 (2021).
145.
Bell, T. et al. In vivo Glx and Glu measurements from GABA-edited MRS at 3 T. NMR in biomedicine 34, e4245 (2021).
146.
Thomson, A. R. et al. In Vivo Glx Measurements From GABA-Edited HERMES at 3 T Are Not Consistent With Those From Short-TE PRESS Across Scanners, Brain Regions, Diagnostic and Age Groups. NMR in Biomedicine 39, e70171 (2026).
147.
Maddock, R. J., Caton, M. D. & Ragland, J. D. Estimating glutamate and Glx from GABA-optimized MEGA-PRESS: Off-resonance but not difference spectra values correspond to PRESS values. Psychiatry Research. Neuroimaging 279, 22–30 (2018).
148.
Archibald, J., Bouchard, A. E., Noeske, R., Shungu, D. C. & Mikkelsen, M. Test-retest reliability of multi-metabolite edited MRS at 3T using PRESS and sLASER. bioRxiv: The Preprint Server for Biology 2025.06.07.657685 (2025) doi:10.1101/2025.06.07.657685.
Supplementary Material
MRS quality
A summary of MRS quality, such as water FWHM, Cr SNR, and frequency shift are provided in Table S1.
| Measure | Rest sLASER | Rest MEGA-PRESS | Movie sLASER | Movie MEGA-PRESS |
|---|---|---|---|---|
| water FWHM (Hz) | 8.47 ± 0.66 | 7.86 ± 0.8 | 8.32 ± 0.72 | 7.95 ± 0.82 |
| Cr SNR | 147.61 ± 20.46 | 101.05 ± 21.42 | 140.6 ± 26 | 98.75 ± 20.01 |
| Frequency Shift (ppm) | -3.08 ± 0.81 | -3.98 ± 0.94 | -3.12 ± 0.76 | -3.85 ± 1.05 |
A summary of voxel placement statistics are provided in Table S2.
| Measure | Amount |
|---|---|
| Voxel Rotation (degrees) | -39 ± 8.13 |
| GM Tissue Fraction | 0.64 ± 0.04 |
| WM Tissue Fraction | 0.24 ± 0.04 |
| CSF Tissue Fraction | 0.12 ± 0.03 |
Linear-mixed effects model diagnostics
Linear-mixed effects model diagnostics are provided in Figure S1.

We report Spearman correlations between E:I and H within each condition (Table S3). Spearman rho values were modest and negative (Movie: \(\rho\) = -0.3, p = 0.23; Rest: \(\rho\) = -0.12, p = 0.62), and consistent with the primary analyses in direction but not statistically significant.
| Condition | spearman_ei_hurst | p_value |
|---|---|---|
| Movie | -0.300 | 0.225 |
| Rest | -0.125 | 0.621 |
We also refit the linear mixed-effects model after removing the top/bottom 10% of observations in E:I, in H, and in the intersection of both (Table S4). Across these trimmed datasets, the E:I fixed-effect estimate remained small and its 95% confidence interval continued to include zero, indicating that the primary conclusion is not driven by extreme values in either E:I or H. Trimming was performed on the pooled long-format dataset (rest and movie rows) to match the model specification.
Taken together with the non-parametric Spearman correlations (Table S3), these analyses indicate that the E:I–H association is weak in this pilot dataset and that our primary inference (a small effect with confidence intervals spanning zero) is unchanged under non-parametric estimation and reasonable exclusion of potential outliers.
| Model | Estimate | SE | CI_low | CI_high |
|---|---|---|---|---|
| Full sample | 0.068 | 0.061 | -0.052 | 0.188 |
| Trimmed EI (10–90%) | 0.010 | 0.125 | -0.236 | 0.256 |
| Trimmed Hurst (10–90%) | 0.018 | 0.045 | -0.070 | 0.107 |
| Trimmed EI & Hurst (intersection) | 0.081 | 0.112 | -0.139 | 0.300 |
Metabolites
sLASER
All metabolite concentrations and Cramer-Rao lower bounds from semi-LASER are reported in Table S5.
| Rest Conc | Rest CRLB | Movie Conc | Movie CRLB | |
|---|---|---|---|---|
| Asc | 0.34 ± 0.29 | 239.72 ± 364.52 | 0.34 ± 0.24 | 194.39 ± 307.8 |
| Asp | 3.49 ± 0.44 | 9.56 ± 1.34 | 3.39 ± 0.43 | 9.72 ± 1.81 |
| Cr | 2.04 ± 0.62 | 16.33 ± 7.65 | 2.1 ± 0.49 | 15.22 ± 5.25 |
| GABA | 0.69 ± 0.41 | 52.78 ± 30.69 | 0.67 ± 0.32 | 49.06 ± 28.51 |
| GPC | 0.92 ± 0.11 | 12.11 ± 4.83 | 0.9 ± 0.11 | 13.56 ± 4.23 |
| GSH | 1.3 ± 0.18 | 7.61 ± 1.38 | 1.32 ± 0.13 | 7.44 ± 1.04 |
| Gln | 2.82 ± 0.58 | 10.11 ± 1.78 | 2.93 ± 0.47 | 9.72 ± 1.02 |
| Glu | 7.02 ± 0.71 | 4.33 ± 0.49 | 7.11 ± 0.62 | 4.17 ± 0.51 |
| mI | 4.77 ± 0.34 | 3 ± 0 | 4.8 ± 0.29 | 3 ± 0 |
| Lac | 0.32 ± 0.13 | 62.78 ± 38.94 | 0.28 ± 0.16 | 182.33 ± 311.77 |
| NAA | 11.88 ± 1.11 | 1.94 ± 0.24 | 11.83 ± 1.03 | 1.83 ± 0.38 |
| NAAG | 0 ± 0 | 999 ± 0 | 0.07 ± 0.22 | 890.78 ± 314.99 |
| PCh | 0.16 ± 0.12 | 292.5 ± 394.55 | 0.18 ± 0.1 | 179.89 ± 299.51 |
| PCr | 5.68 ± 0.84 | 5.83 ± 1.04 | 5.7 ± 0.69 | 6.11 ± 1.23 |
| PE | 1.67 ± 0.49 | 31.28 ± 11.85 | 1.71 ± 0.53 | 29.5 ± 8.58 |
| sI | 0.13 ± 0.12 | 198.61 ± 369.4 | 0.13 ± 0.11 | 127.56 ± 244.45 |
| Tau | 1.63 ± 0.35 | 15.44 ± 3.2 | 1.65 ± 0.3 | 15.06 ± 3.23 |
| CrCH2 | 0.26 ± 0.28 | 433.94 ± 469.27 | 0.24 ± 0.2 | 285.11 ± 397.57 |
| tCho | 1.07 ± 0.09 | 3.72 ± 0.46 | 1.07 ± 0.09 | 3.56 ± 0.62 |
| tCr | 7.72 ± 0.41 | 1.44 ± 0.51 | 7.8 ± 0.37 | 1.39 ± 0.5 |
| tNAA | 11.88 ± 1.11 | 1.94 ± 0.24 | 11.91 ± 1.04 | 1.83 ± 0.38 |
| Glx | 9.84 ± 1.06 | 4.39 ± 0.5 | 10.04 ± 0.79 | 4.17 ± 0.51 |
| Lip13a | 18.63 ± 7.85 | 76.06 ± 230.43 | 20 ± 7.47 | 21.78 ± 6.48 |
| Lip13b | 0.07 ± 0.3 | 944.39 ± 231.7 | 0 ± 0 | 999 ± 0 |
| Lip09 | 4.91 ± 2.05 | 25 ± 9.44 | 5.22 ± 2.04 | 27 ± 10.96 |
| MM09 | 3.1 ± 2.15 | 112.67 ± 226.41 | 3.03 ± 1.5 | 103.56 ± 227.35 |
| Lip20 | 3.64 ± 1.34 | 15.5 ± 4.26 | 4.05 ± 1 | 14.44 ± 3.07 |
| MM20 | 3.88 ± 3.43 | 242.11 ± 383.63 | 3.41 ± 2.16 | 143 ± 262.51 |
| MM12 | 0.95 ± 0.93 | 316.28 ± 389.01 | 0.99 ± 0.97 | 333.78 ± 425.72 |
| MM14 | 4.45 ± 2.14 | 34.39 ± 21.5 | 5.11 ± 2.63 | 35.67 ± 25.59 |
| MM17 | 2.56 ± 1.84 | 246.39 ± 414.02 | 2.69 ± 1.1 | 39.89 ± 31.22 |
MEGA-PRESS
All metabolite concentrations and Cramer-Rao lower bounds from J-edited MEGA-PRESS are reported in Table S6.
| Rest Conc | Rest CRLB | Movie Conc | Movie CRLB | |
|---|---|---|---|---|
| GABA | 1.64 ± 0.36 | 16.61 ± 5.51 | 1.55 ± 0.43 | 18.5 ± 5.86 |
| GSH | 2.41 ± 0.6 | 4.72 ± 0.57 | 2.17 ± 0.62 | 5.06 ± 0.94 |
| Gln | 2.59 ± 0.95 | 74.56 ± 230.78 | 2.4 ± 0.56 | 24.11 ± 9.54 |
| Glu | 12.41 ± 1.76 | 4.06 ± 0.64 | 12.11 ± 1.65 | 4.33 ± 0.77 |
| NAA | 16.47 ± 1.49 | 9.94 ± 2.21 | 16.29 ± 2.01 | 10.39 ± 1.5 |
| NAAG | 1.8 ± 0.57 | 16.61 ± 5.51 | 2.02 ± 1.07 | 18.5 ± 5.86 |
| tNAA | 18.27 ± 1.41 | 4.72 ± 0.57 | 18.31 ± 1.65 | 5.06 ± 0.94 |
| Glx | 15 ± 1.51 | 74.56 ± 230.78 | 14.51 ± 1.57 | 24.11 ± 9.54 |
| MM09 | 3.84 ± 0.77 | 4.06 ± 0.64 | 3.69 ± 0.49 | 4.33 ± 0.77 |
| GABAplus | 5.48 ± 0.77 | 9.94 ± 2.21 | 5.23 ± 0.71 | 10.39 ± 1.5 |
Data quality
Data quality correlations for Hurst with mean framewise displacement, Glx and GABA+ with FWHM, and Glx and GABA+ with frequency shift are shown in Figure S2.

Rest vs movie FWHM comparisons (paired t-tests) are provided in Table S7.
| Seq | m. rest | m. movie | m. diff | sd diff | t | p | CIlow | CIhigh |
|---|---|---|---|---|---|---|---|---|
| MEGA | 7.86 | 7.95 | 0.09 | 0.51 | 0.75 | 0.46 | -0.16 | 0.34 |
| sLASER | 8.47 | 8.32 | -0.15 | 0.49 | -1.28 | 0.22 | -0.39 | 0.10 |
Rest vs movie FWHM comparisons (paired t-tests) are provided in Table S8.
| Seq | m. rest | m. movie | m. diff | sd diff | t | p | CIlow | CIhigh |
|---|---|---|---|---|---|---|---|---|
| MEGA | 101.05 | 98.75 | -2.30 | 9.39 | -1.04 | 0.31 | -6.97 | 2.36 |
| sLASER | 147.61 | 140.60 | -7.01 | 22.84 | -1.30 | 0.21 | -18.37 | 4.34 |
Subject-level FWHM and CR-SNR values for each sequence (Rest, Movie, and Movie–Rest difference) are provided in Table S9.
| Sub | Seq | R FWHM | M FWHM | Diff FWHM | R SNR | M SNR | Diff SNR |
|---|---|---|---|---|---|---|---|
| 1 | sLASER | 8.36 | 8.04 | -0.33 | 135.58 | 125.26 | -10.32 |
| 1 | MEGA | 7.38 | 7.41 | 0.03 | 91.29 | 92.46 | 1.17 |
| 2 | sLASER | 8.57 | 7.72 | -0.85 | 128.76 | 147.92 | 19.16 |
| 2 | MEGA | 7.73 | 7.15 | -0.58 | 82.16 | 84.05 | 1.89 |
| 4 | sLASER | 8.61 | 8.93 | 0.31 | 162.00 | 132.33 | -29.67 |
| 4 | MEGA | 9.23 | 8.56 | -0.66 | 98.51 | 103.83 | 5.31 |
| 6 | sLASER | 8.01 | 7.94 | -0.06 | 130.77 | 152.24 | 21.47 |
| 6 | MEGA | 7.35 | 7.58 | 0.23 | 128.02 | 122.19 | -5.83 |
| 7 | sLASER | 9.08 | 9.10 | 0.02 | 112.42 | 99.45 | -12.97 |
| 7 | MEGA | 9.17 | 8.95 | -0.22 | 75.46 | 84.31 | 8.85 |
| 9 | sLASER | 8.27 | 8.53 | 0.26 | 172.88 | 161.56 | -11.32 |
| 9 | MEGA | 8.02 | 8.51 | 0.49 | 115.78 | 108.07 | -7.71 |
| 10 | sLASER | 7.65 | 7.46 | -0.20 | 168.43 | 173.85 | 5.41 |
| 10 | MEGA | 6.66 | 7.20 | 0.55 | 115.75 | 103.79 | -11.96 |
| 11 | sLASER | 9.53 | 8.57 | -0.96 | 157.59 | 136.11 | -21.48 |
| 11 | MEGA | 7.73 | 8.83 | 1.10 | 101.11 | 87.58 | -13.52 |
| 12 | sLASER | 8.39 | 7.79 | -0.60 | 180.44 | 136.71 | -43.73 |
| 12 | MEGA | 7.46 | 7.43 | -0.03 | 113.05 | 112.73 | -0.32 |
| 13 | sLASER | 7.73 | 8.45 | 0.72 | 158.00 | 207.77 | 49.78 |
| 13 | MEGA | 7.06 | 7.09 | 0.03 | 147.40 | 147.57 | 0.17 |
| 15 | sLASER | 9.27 | 8.25 | -1.03 | 161.54 | 135.97 | -25.57 |
| 15 | MEGA | 7.93 | 7.40 | -0.53 | 105.05 | 124.51 | 19.47 |
| 16 | sLASER | 9.23 | 9.19 | -0.04 | 155.48 | 135.41 | -20.07 |
| 16 | MEGA | 8.32 | 8.29 | -0.03 | 102.73 | 97.17 | -5.55 |
| 18 | sLASER | 8.57 | 8.33 | -0.24 | 116.65 | 117.28 | 0.62 |
| 18 | MEGA | 7.91 | 7.51 | -0.40 | 75.65 | 83.37 | 7.71 |
| 19 | sLASER | 8.39 | 8.57 | 0.18 | 169.98 | 145.07 | -24.92 |
| 19 | MEGA | 7.63 | 8.01 | 0.37 | 126.17 | 107.86 | -18.31 |
| 20 | sLASER | 7.94 | 7.93 | 0.00 | 146.29 | 156.69 | 10.40 |
| 20 | MEGA | 7.16 | 8.24 | 1.08 | 100.81 | 85.99 | -14.82 |
| 22 | sLASER | 9.51 | 9.86 | 0.35 | 121.74 | 96.63 | -25.11 |
| 22 | MEGA | 9.20 | 9.43 | 0.24 | 60.44 | 60.70 | 0.26 |
| 24 | sLASER | 7.18 | 6.67 | -0.50 | 138.38 | 121.95 | -16.43 |
| 24 | MEGA | 6.73 | 6.44 | -0.29 | 85.78 | 83.25 | -2.53 |
| 26 | sLASER | 8.12 | 8.42 | 0.31 | 140.13 | 148.61 | 8.48 |
| 26 | MEGA | 8.76 | 9.03 | 0.27 | 93.80 | 88.04 | -5.76 |
Plots of individual water FWHM changes between rest and movie-watching conditions for both MEGA-PRESS and sLASER are shown in Figure S3.

Frequency shift between rest and movie are shown in Figure S4.

Gannet Results
An example fit result from Gannet of a subject at rest is shown in Figure S5.
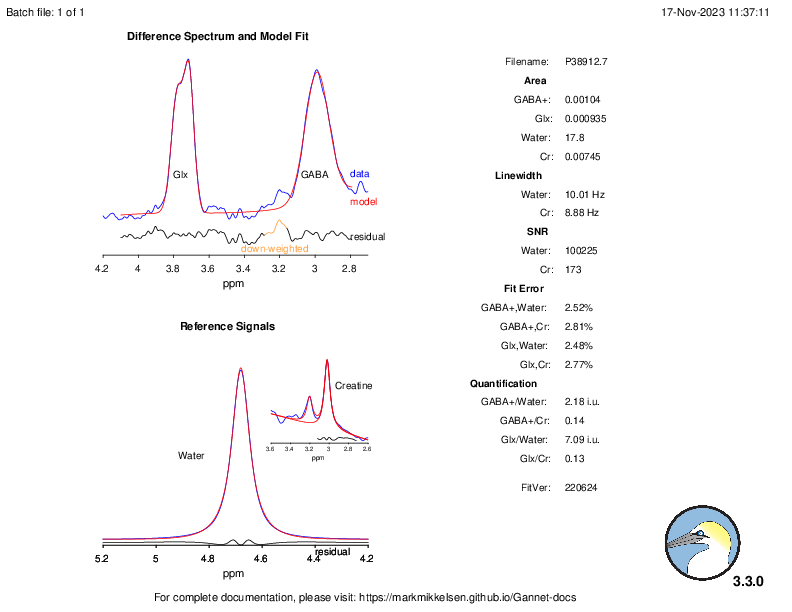
To examine the relationship between H and E:I, we ran a linear mixed-effects model. The model’s total explanatory power was substantial (conditional r2 = 0.64), with fixed effects (marginal r2) equal to 0.23. The model’s intercept, corresponding to EI = 0, Condition = Movie, FWHMMEGA-PRESS = 0, FreqShiftMEGA-PRESS = 0, and meanFD = 0, was 1.2 (95% CI [0.66, 1.7], t(26) = 4.64, p < 0.01). Within this model, only the effect of Condition [Rest] was statistically significant (beta = -0.08, 95% CI [-0.13, -0.03], t(26) = -3.32, p < 0.01). The effect of E:I was statistically non-significant (beta = -0.07, 95% CI [-0.21, 0.06], t(26) = -1.04, p = 0.31); along with FWHMMEGA-PRESS (beta = 0.03, 95% CI [-0.03, 0.08], t(26) = 0.96, p = 0.35); FreqShiftMEGA-PRESS (beta = 0.01, 95% CI [-0.02, 0.05], t(26) = 0.63, p = 0.53); and meanFD (beta = -0.76, 95% CI [-2.34, 0.82], t(26) = -0.95, p = 0.35).
Mean ± sd of metabolites and E:I when analyzed using Gannet, during rest and movie, are reported in Table S10. Boxplots between rest and movie can be seen in Figure S6. Neither Glx nor GABA+ were different between movie and rest conditions. E:I ratio did not change between conditions either.
| Rest | Movie | p-value | |
|---|---|---|---|
| Glx | 10.84 ± 1.06 | 10.72 ± 0.68 | 0.43 |
| GABA+ | 3.59 ± 0.38 | 3.53 ± 0.36 | 0.33 |
| E:I Ratio | 1.82 ± 0.25 | 1.94 ± 0.25 | 0.08 |

H was not found to correlate with Glx (Rest: r = 0, p = 0.99; Movie: r = -0.27, p = 0.28), GABA+ (Rest: r = 0.02, p = 0.93; Movie: r = 0.11, p = 0.67), or E:I (Rest: r = -0.04, p = 0.89; Movie: r = -0.32, p = 0.2) (Figure S7).

Glx estimates were not strongly correlated between sLASER and MEGA-PRESS (Rest \(r = 0.06\), Movie \(r = 0.25\)), while mean absolute differences remained under 1 institutional units. Table S11 reports the paired summary statistics, and Figure S8 visualises the subject-level agreement.
This finding is consistent with several studies that have directly compared Glx measured from MEGA-PRESS “OFF” spectra, with ‘gold standard’ short-TE sequences (PRESS and sLASER), which have consistently reported poor agreement79,145,146. Reasons for this include the fact that MEGA-PRESS uses a longer TE time (68 ms compared to sLASER’s 35 ms)147; chemical shift displacement error differences between the two sequences148; and scanner drift due to MEGA-PRESS being acquired on average 6.43 ± 1.67 (Rest) and 5.89 ± 0.95 minutes (Movie) after sLASER.
| Cond | n | m. sLASER | m. MEGA | m. diff | sd diff | m.a. diff | r | p | CIlow | CIhigh |
|---|---|---|---|---|---|---|---|---|---|---|
| Movie | 18 | 10.04 | 10.72 | -0.67 | 0.90 | 0.91 | 0.25 | 0.31 | -0.24 | 0.64 |
| Rest | 18 | 9.84 | 10.84 | -1.00 | 1.45 | 1.28 | 0.06 | 0.80 | -0.42 | 0.51 |
